


South African Rand, Dollar Latest:
- SARB (South African Reserve Bank) raises the repo rate by 25-basis points to 7.25% (below expectations of 7.5%).
- USD/ZAR digests commentary from the MPC (monetary policy committee) – load shedding and the intense power-cuts dampen sentiment as productivity declines.
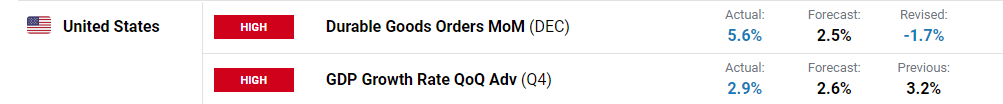
- US GDP and durable goods beat estimates highlighting a resilient US economy

SARB Raises Rates by 0.25%, Growth Forecasts Sink
The SARB (the South African Reserve Bank) has announced another 25 basis-point rate hike, below market expectations for a 50-basis point hike. With the repo rate now rising to 7.25% (up from 7%), the MPC (monetary policy committee) meeting provided a gloomy outlook for the power-stricken nation.

DailyFX Economic Calendar
In anticipation of next week’s FOMC, the release of US economic data could pose an additional threat to the volatile Rand. Although Dollar weakness has limited USD/ZAR gains, the emerging market (EM) currency remains vulnerable to investor’s appetite for risk.
Learn more about how central banks impact the forex market and the effects of central bank intervention in the forex market.
Not only is the country experiencing the worst power-cuts in history, corruption, poor maintenance and lack of accountability has caused the inequality gap to widen. With the main power utility, Eskom, currently increasing the duration of the blackouts (called load shedding), power cuts amount to approximately eight – ten hours without electricity.

As the energy component remains the main contributor to inflation, Eskom has proposed another 18.5% increase in the price of electricity (a decision that is currently on hold).
This means that business owners need to rely of other sources of energy while covering rising costs of production. n the MPC committee meeting earlier today, the power crisis remained at the forefront of growth prospects which has deteriorated further.
Meanwhile, the release of US GDP and durable goods orders highlighted a resilient economy with both readings exceeding expectations.
Customize and filter live economic data via our DailyFX economic calendar
USD/ZAR Technical Analysis
After rising to a high of 18.579 in October last year, expectations of the Fed slowing the pace of tightening buoyed USD weakness, driving the pair lower. As the move gained traction, prices continued to fall, driving prices to a five-month low of 16.694 earlier this month. With a broader range of support and resistance forming between key Fibonacci levels from prior moves.
USD/ZAR Weekly Chart
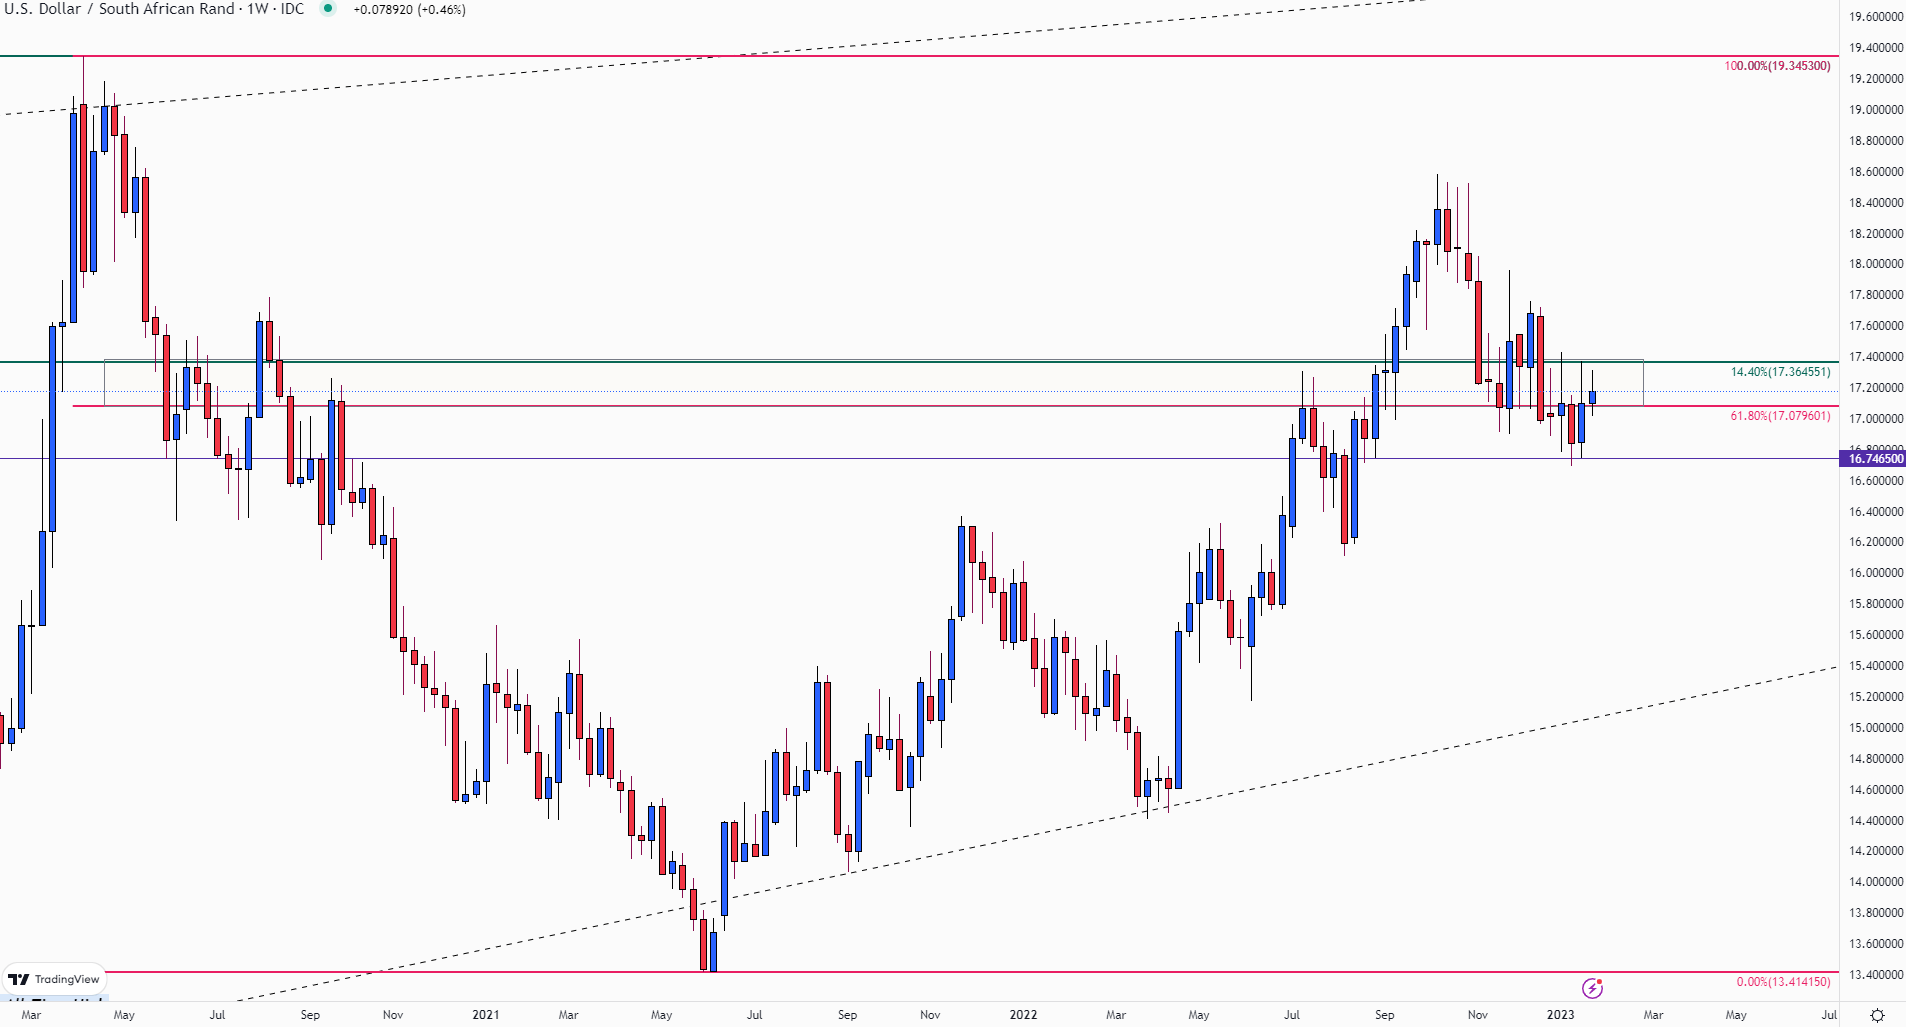
Chart prepared by Tammy Da Costa using TradingView
With last week’s candle erasing the prior week’s losses, a break of 17.00 and of 17.079 (61.8% Fibonacci of the 2020 – 2021 move) drove prices towards the 14.4% Fibonacci of the 2004 – 2020 move at 17.364.
While the daily chart further highlights the range that has developed in recent weeks, the descending trendline from the Oct – Jan move has formed an additional zone of support at prior resistance (17.000).
USD/ZAR Daily Chart
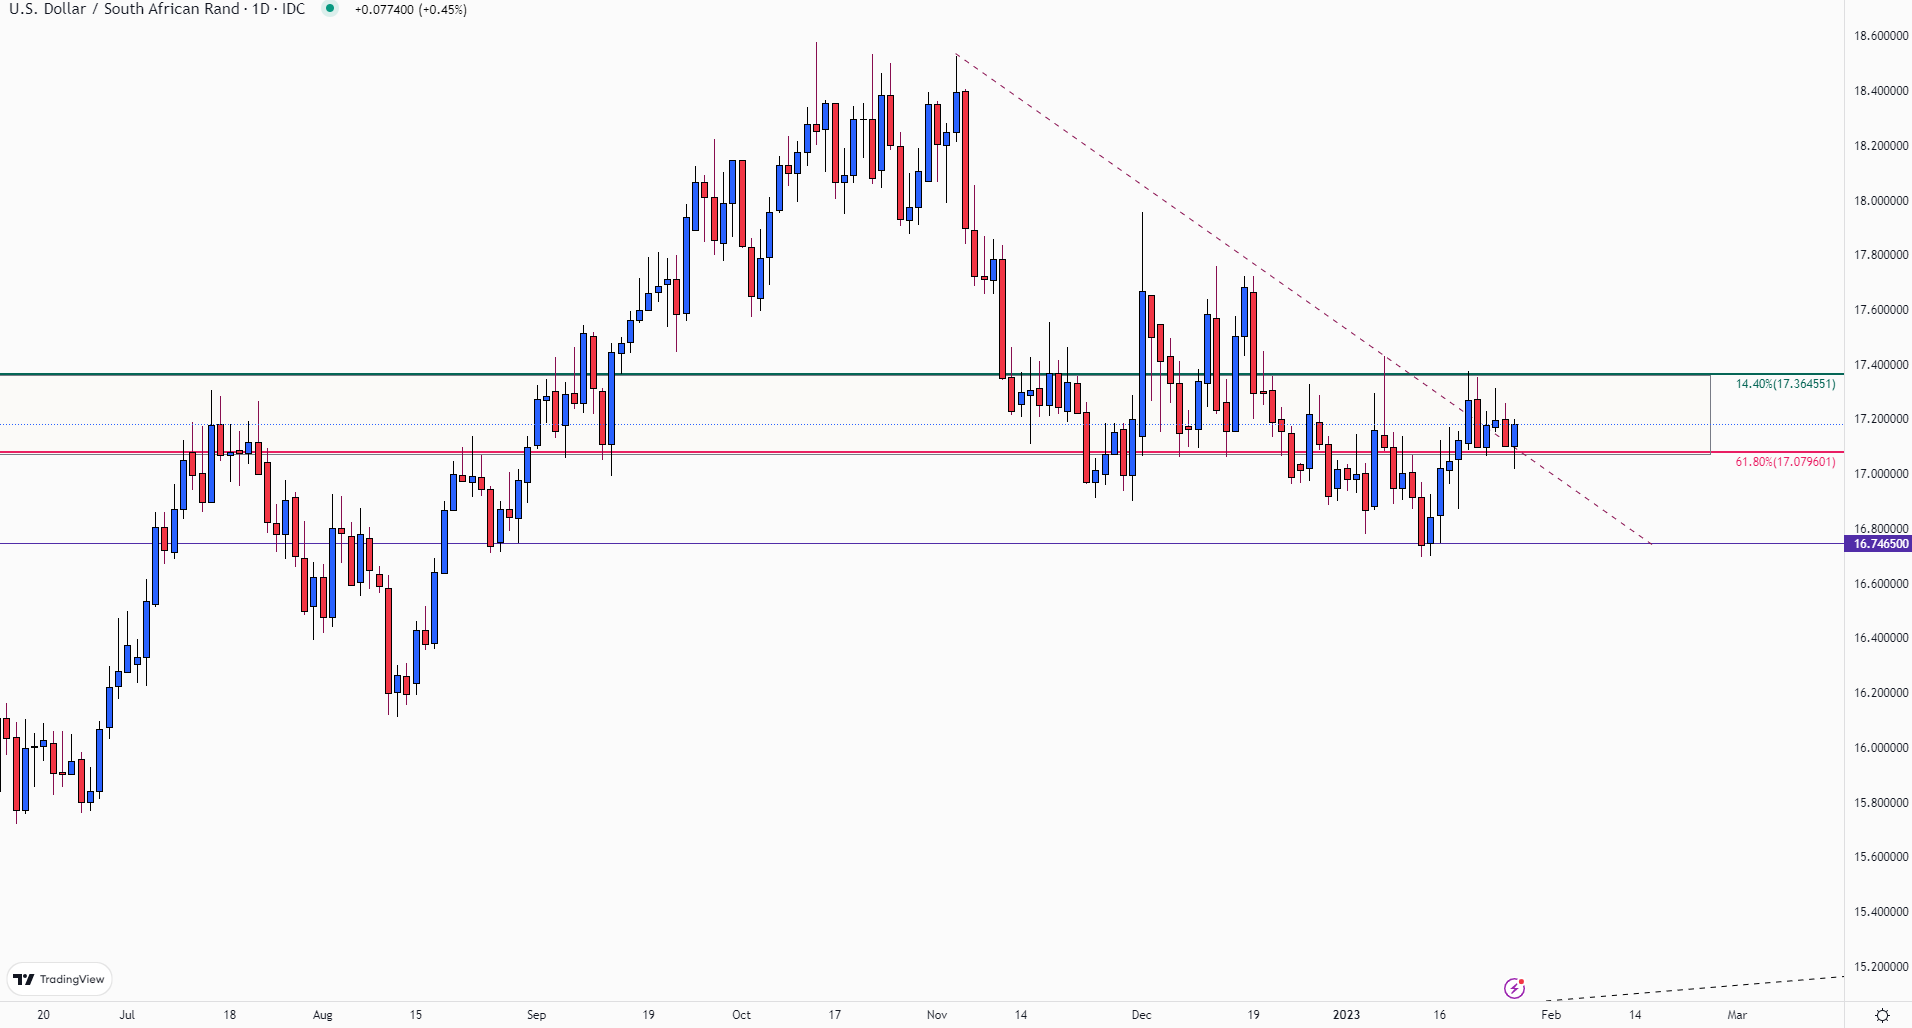
Chart prepared by Tammy Da Costa using TradingView
Meanwhile, on the four-hour chart, the17.200 handle has provided another hurdle while the long lower-wicks below 17.00 represent a strong retaliation from buyers which lifts prices higher.
USD/ZAR Four-Hour Chart
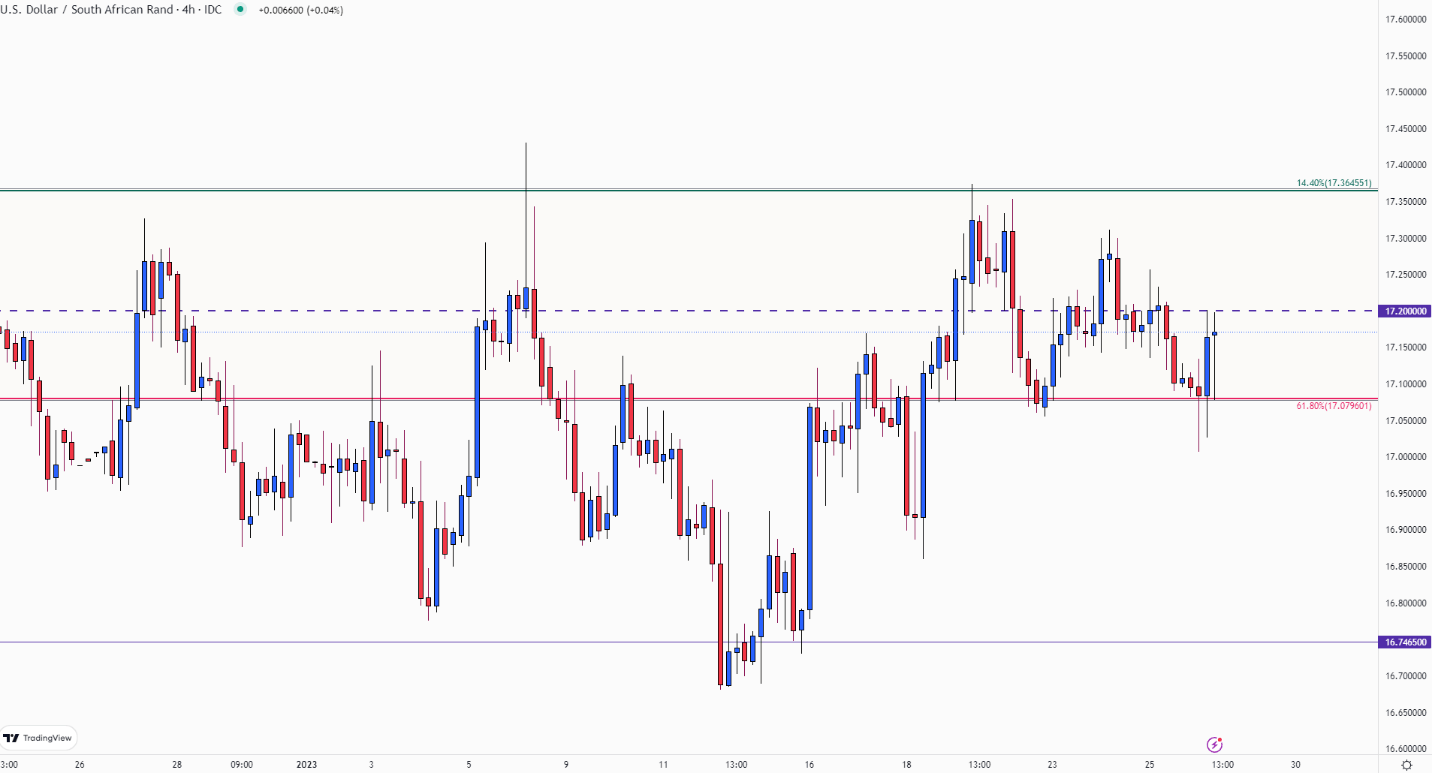
Chart prepared by Tammy Da Costa using TradingView
For the uptrend to hold, prices will need to gain traction above 17.200 to retest 17.300. Above that, the 17.365 Fib looms bringing 17.500 back into play.
Trade Smarter - Sign up for the DailyFX Newsletter
Receive timely and compelling market commentary from the DailyFX team
--- Written by Tammy Da Costa, Analyst for DailyFX.com
Contact and follow Tammy on Twitter: @Tams707


