


WTI, OPEC+ – Talking Points
- OPEC+ agrees to cut oil production by 2 mln barrels per day
- WTI rallies into key trendline resistance, 50-day moving average
- White House extremely disappointed with OPEC “alignment with Russia”

Oil is continuing to rally late in the New York session following the decision by OPEC+ to cut production by 2 million barrels per day starting in November. The production cut comes as OPEC+ ministers look to inject life into crude markets that have slumped over the last few months. Global recession fears have taken oil prices from a yearly high of $129 per barrel to current levels around $87/bbl, as tighter monetary policy looks set to curb economic activity.
This morning’s announcement from Vienna came as an unwelcome surprise to Washington, with the White House working to increase oil supply in order to lower domestic prices at the pump. In a statement released following the OPEC+ decision, the White House indicated it was disappointed by the “shortsighted decision… to cut production quotas while the global economy is dealing with the continued negative impact of Putin’s invasion of Ukraine.”
WTI 1 Hour Chart
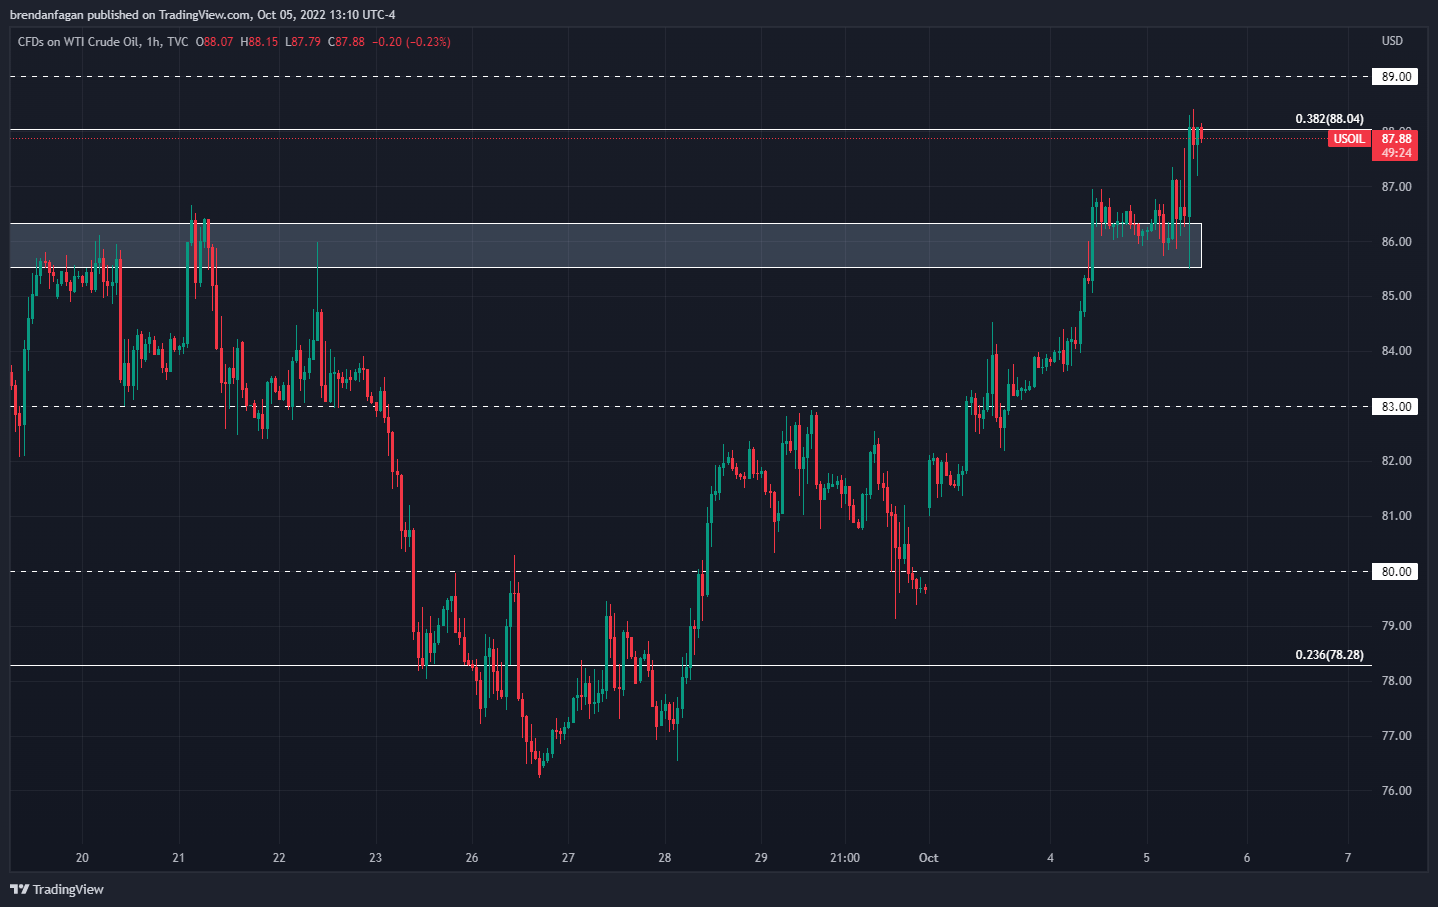
Chart created with TradingView
WTI prices have pushed higher following this morning’s OPEC decision, after a strong rally into the event over the last week. Global growth concerns saw WTI trade to fresh yearly lows below $76.50 before staging this recent rally. The strong move off of these lows now sees WTI challenging trendline resistance that has limited upside potential for the last 3 months. The 50-day moving average can also be found here at $88, which may offer additional resistance to this upside move. A topside break of these key impediments will worry many, as higher energy costs could be around the corner. Just as central banks are looking to reign in rampant inflation, we may see another surge in the energy component of global CPI calculations.
WTI Daily Chart
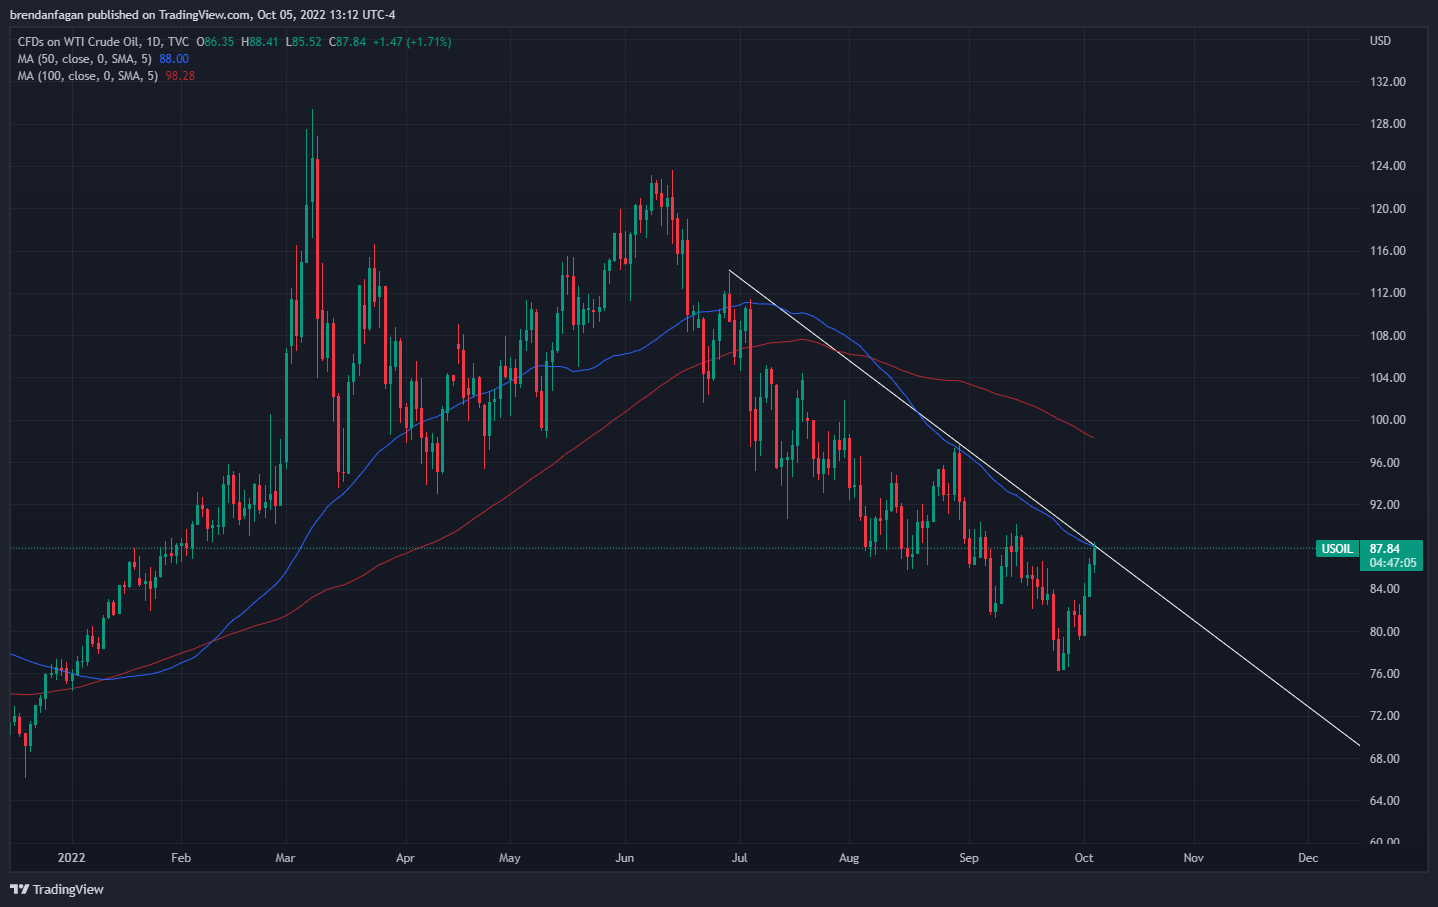
Chart created with TradingView
Trade Smarter - Sign up for the DailyFX Newsletter
Receive timely and compelling market commentary from the DailyFX team
RESOURCES FOR FOREX TRADERS
Whether you are a new or experienced trader, we have several resources available to help you; indicator for tracking trader sentiment, quarterly trading forecasts, analytical and educational webinars held daily, trading guides to help you improve trading performance, and one specifically for those who are new to forex.
--- Written by Brendan Fagan
To contact Brendan, use the comments section below or @BrendanFaganFX on Twitter


