


Oil Talking Points:
- WTI Crude Oil searches for resistance above $70 per barrel.
- Brent Crude finds support above $80.00
- Russia, Ukraine conflict reaches one year mark, adding pressure to the oil trajectory over the next year.

Today marks the one-year anniversary since the invasion of Ukraine which has had detrimental effects on the oil and energy market.
With the Covid-19 pandemic and stringent lockdowns pushing WTI crude oil futures into negative territory for the first time in history, prices have rebounded, rising above the 80.00 handle.
As the economy rebounded and the conflict exacerbated supply constraints, both WTI and Brent Crude oil have remained above the 70.00 mark.
Since Russia is a major exporter of oil and other energy supplies, Brent crude has illustrated a slightly higher degree of sensitivity to the supply disruptions that drove BR Crude futures to a high of 139.13 in March of last year (07 March ‘22). Although the lockdowns in China have provided an additional catalyst for the short-term move, the reopening of the second largest economy has contributed to higher prices.
Brent Crude Oil Futures (BR1!) Daily Chart
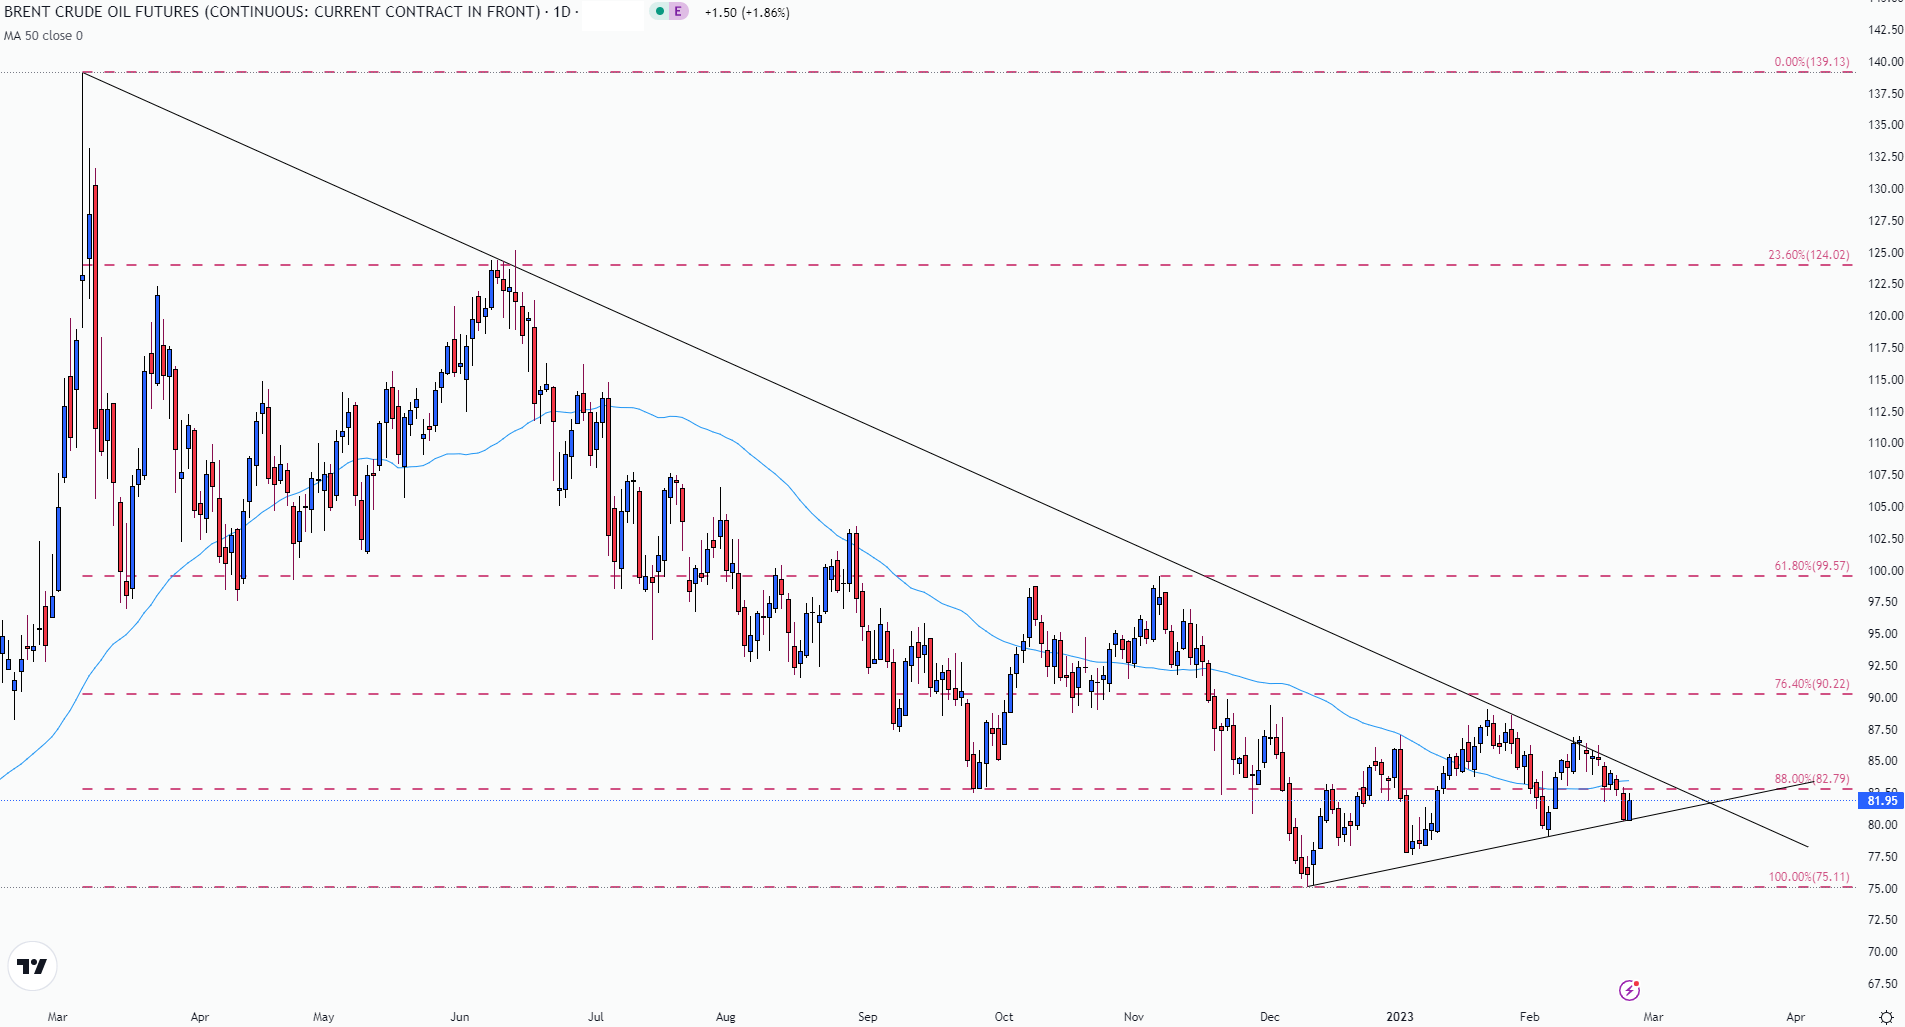
Chart prepared by Tammy Da Costa using TradingView
While the 50-day MA (moving average) holds as resistance at $83.44, Brent crude remains suppressed, treading around $81.95. Although a reduction in supplies were temporarily offset by the lower demand, the descending trendline from the last year’s move has now come in as resistance at the psychological level of $82.00 p/b. A move higher brings the 88% retracement of the 2022 move into the spotlight at 82.79, paving the way for a break of the bearish trendline resistance.
WTI (CL1) Daily Chart
| Change in | Longs | Shorts | OI |
| Daily | 2% | 5% | 3% |
| Weekly | -8% | 13% | -2% |
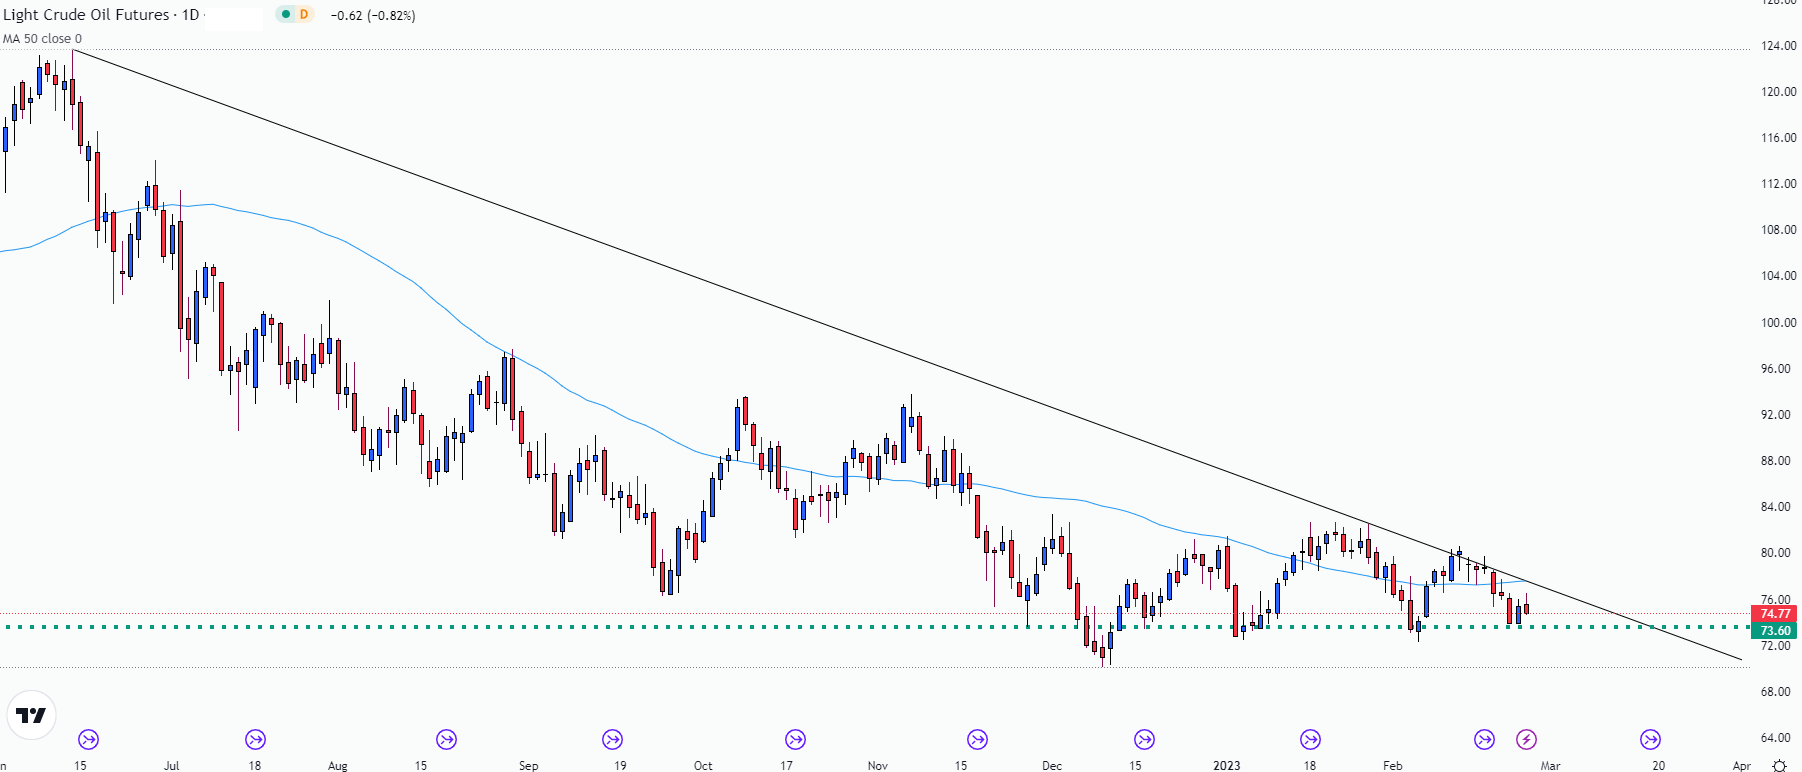
Chart prepared by Tammy Da Costa using TradingView
For US WTI futures, a move above support at 73.6 has pushed prices toward the next level of psychological resistance at the upper bound of the descending triangle at 76.00. If prices are able to break the 50-day MA (at 77.56), there may be a probable retest of 80.00, with the opposite said true for a downward break of 73.60 (which could drive prices to the 70.00) mark.
--- Written by Tammy Da Costa, Analyst for DailyFX.com
Contact and follow Tammy on Twitter: @Tams707


