


Natural Gas Technical Highlights:
- Big decline has support in play, price action is strong
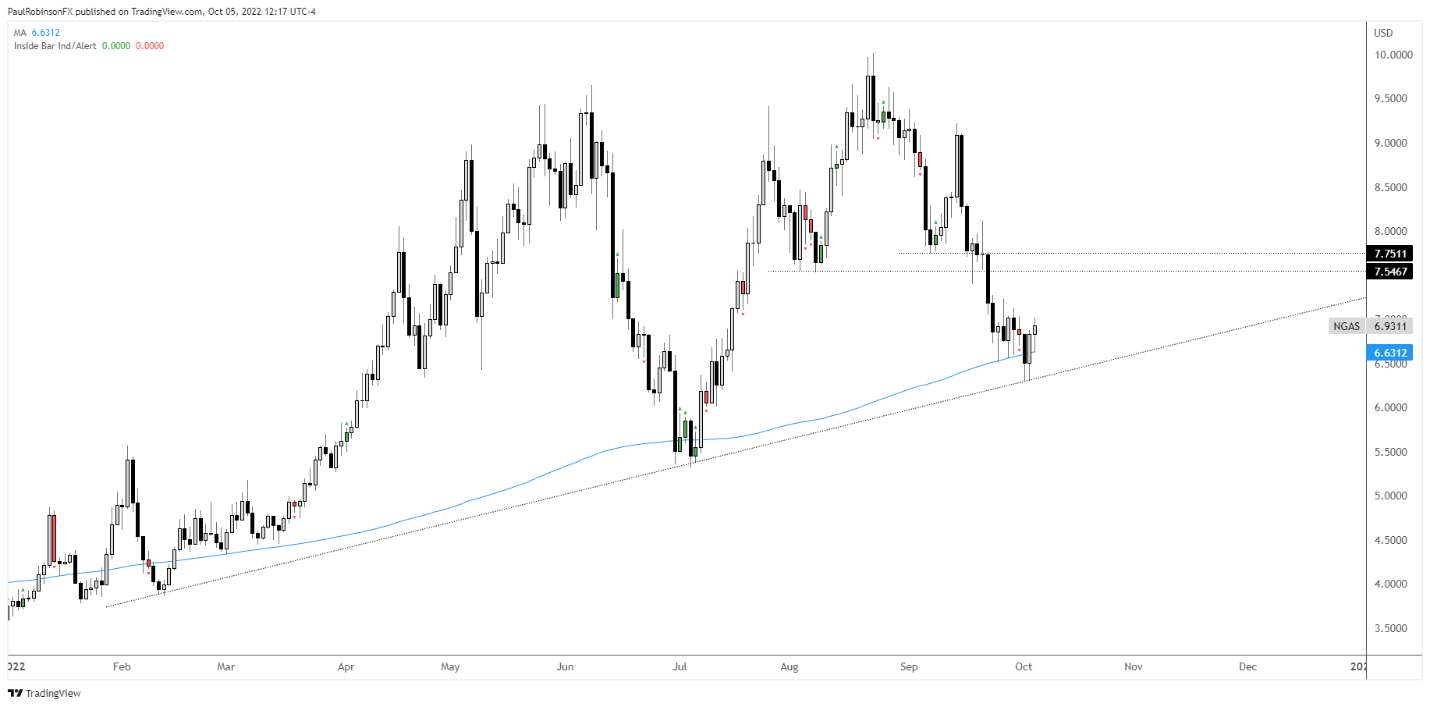
- Sizable rally could develop following flush of 200-day
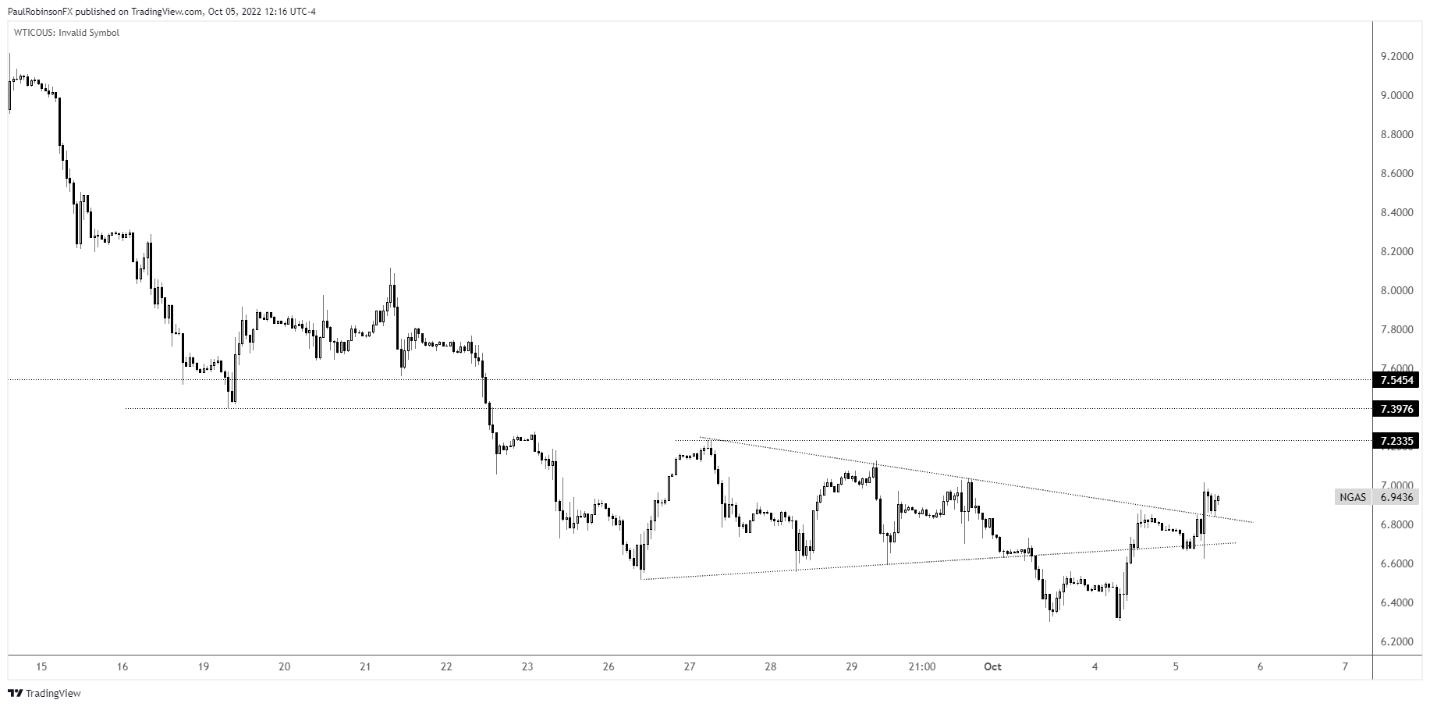
Natural gas declined nearly 40% from its yearly high just as the new week began. The decline brought into play the 200-day moving average and a trend-line dating to February. The strong reaction around the 200 suggests a low could be in. Looking at the hourly chart the action around the 200-day played out as a wedge formation that failed to follow through, and is in the process of getting broken in the opposite direction. Failed continuation patterns often lead to strong reversals in the opposite direction, especially when they occur around major levels. Looking higher, there is resistance around 7.23, 7.40, and 7.55. It wouldn't be surprising, though, to soon have gas trading in the 8s. A sustained breakdown below the weekly low at 6.30 would put nat gas back on its heels.
Natural Gas Daily Chart
Natural Gas Hourly Chart
Natural Gas Charts by TradingView
Resources for Forex Traders
Whether you are a new or experienced trader, we have several resources available to help you; indicator for tracking trader sentiment, quarterly trading forecasts, analytical and educational webinars held daily, trading guides to help you improve trading performance, and one specifically for those who are new to forex.
---Written by Paul Robinson, Market Analyst
You can follow Paul on Twitter at @PaulRobinsonFX


