


Natural Gas, EU Price Cap, Warm Weather, Technical Outlook – Talking Points
- Natural gas prices in the United States and Europe plummeted on Monday
- Warm temps and ahead-of-schedule inventory levels ease worries ahead of winter
- The technical outlook suffered a key setback on Monday as prices gapped lower

Natural gas prices in Europe and the United States dropped sharply on Monday, helping to ease concerns for the commodity heading into the winter months. A backdrop composed of warmer-than-usual weather and ahead-of-schedule inventory buildups in the US and the EU has helped to cool speculative pressure on the commodity at a critical time.
According to a draft proposal reported by Reuters, the European Union appears ready to move forward with a “dynamic” price cap for LNG. The Agency for Cooperation of Energy Regulators (ACER) would be tasked with implementing the price cap. The ACER’s mandate would target prices at the Dutch Title Transfer Facility (TFF)—the virtual pricing point for EU natural gas. The exact effectiveness of a price cap remains debated, but for now, the market appears to see it as a bearish price development.
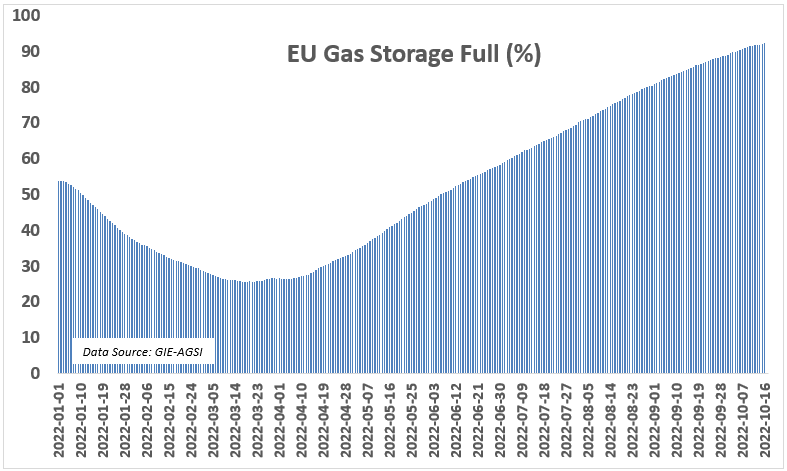
Still, EU governments would need to reach a consensual agreement on the move, which Germany may oppose. Meanwhile, the bloc has made better-than-expected progress on its inventory buildup, with AGSI-GIE data showing that EU storage levels rose above the 92% mark as of October 15. So far, October has been a mild month in terms of temperatures across most of Europe—a welcome development for the energy situation. If the weather remains mild, it should keep prices depressed even if the EU stumbles on implementing price cap measures.

US prices are falling amid mild temperatures. The National Weather Service’s 8 to 14-day temperature outlook shows a high probability for above-average temperatures across the eastern half of the United States. That should temper gas demand. Moreover, the NWS sees above-normal precipitation across the western US, which would bolster the supply of hydroelectricity.
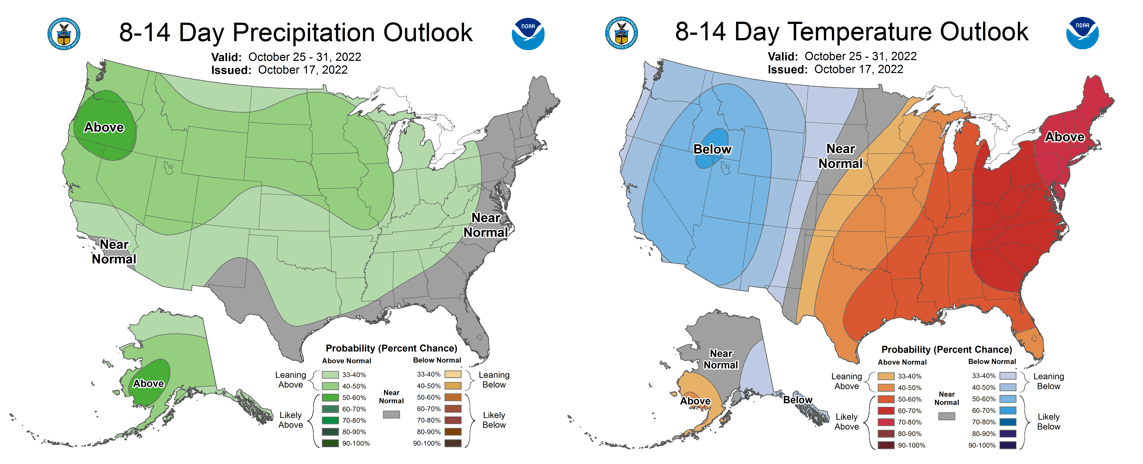
Source: cpc.ncep.noaa.gov
Another notable market development comes from Africa, where Nigeria LNG Ltd. announced a force majeure due to flooding at its Bonny Island LNG facility. The company procures over 20 million tons of liquified natural gas (LNG) per year. However, the extent of disruption from the force majeure is not fully realized yet, although the company said it was working to limit operational disruptions. The market seems unfazed, but a prolonged outage may provide a tailwind to prices if the chances for an extended outage rise.

Natural Gas Technical Outlook
Natural gas prices broke below several key technical barriers on Monday, significantly weakening its technical posture and threatening further losses. Monday’s price action left an open gap after a 7.04% daily drop, which pierced below the 200-day Simple Moving Average (SMA) and a trendline from December 2021. Meanwhile, MACD is tracking lower near the weakest levels since early July. A move lower may follow, with the 78.6% Fibonacci and the 5 psychological level on the table as possible targets.
Natural Gas Daily Chart
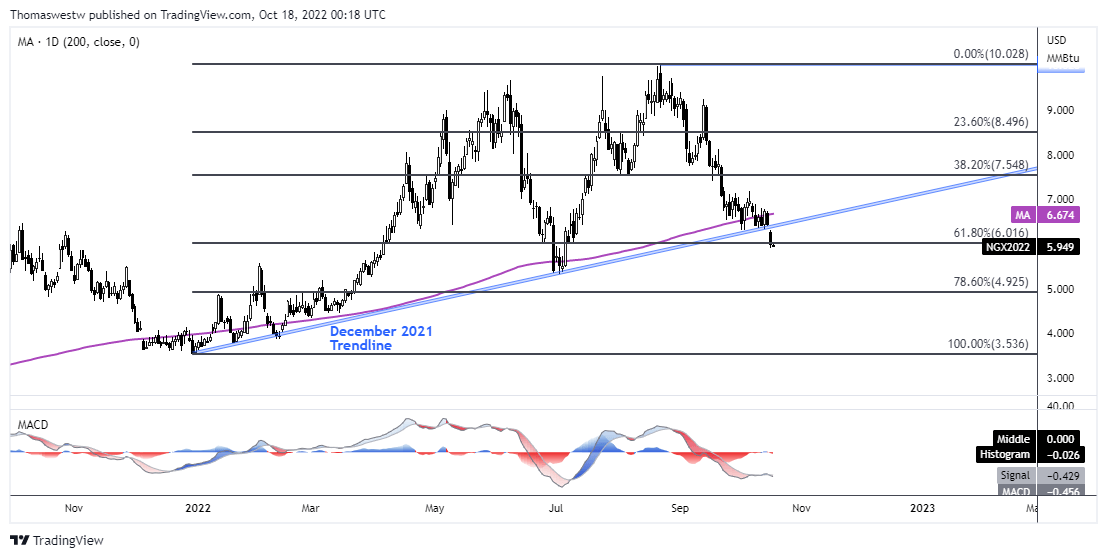
Chart created with TradingView
--- Written by Thomas Westwater, Analyst for DailyFX.com
To contact Thomas, use the comments section below or @FxWestwater on Twitter


