

US Equities Technical Forecast:
- Nasdaq 100, Dow Jones, S&P 500 appear at risk going forward
- Nasdaq confirms a trendline breakout as Dow clears a triangle
- S&P 500 on the verge of confirming a bearish wedge breakout

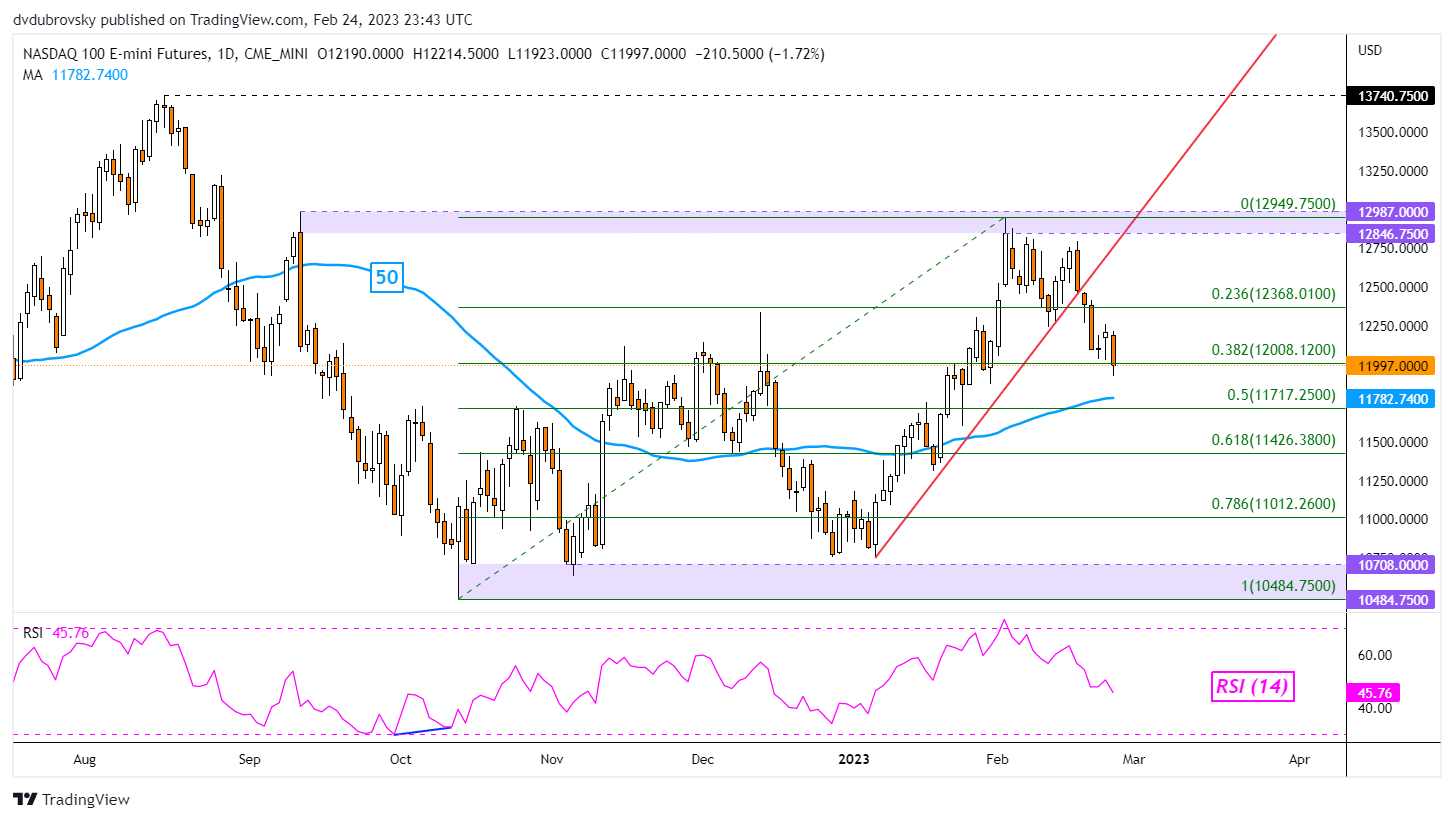
Nasdaq 100 Outlook - Bearish
The Nasdaq 100 is appearing increasingly bearish heading into the new trading week. On the daily chart, the index confirmed a breakout under a near-term rising trendline from the beginning of this year. This has set the stage for a reversal of the uptrend from about 10708 – 12987. Immediate support is the 38.2% Fibonacci retracement level at 12008.
Breaking lower exposes the 50-day Simple Moving Average (SMA). The latter could hold as support, maintaining an upside focus. Otherwise, extending beyond that places the focus on the 61.8% Fibonacci retracement level at 11426 towards the 10484 – 10708 support zone. On the flip side, key resistance seems to be the 23.6% level at 12368 towards the 12846 – 12987 range.
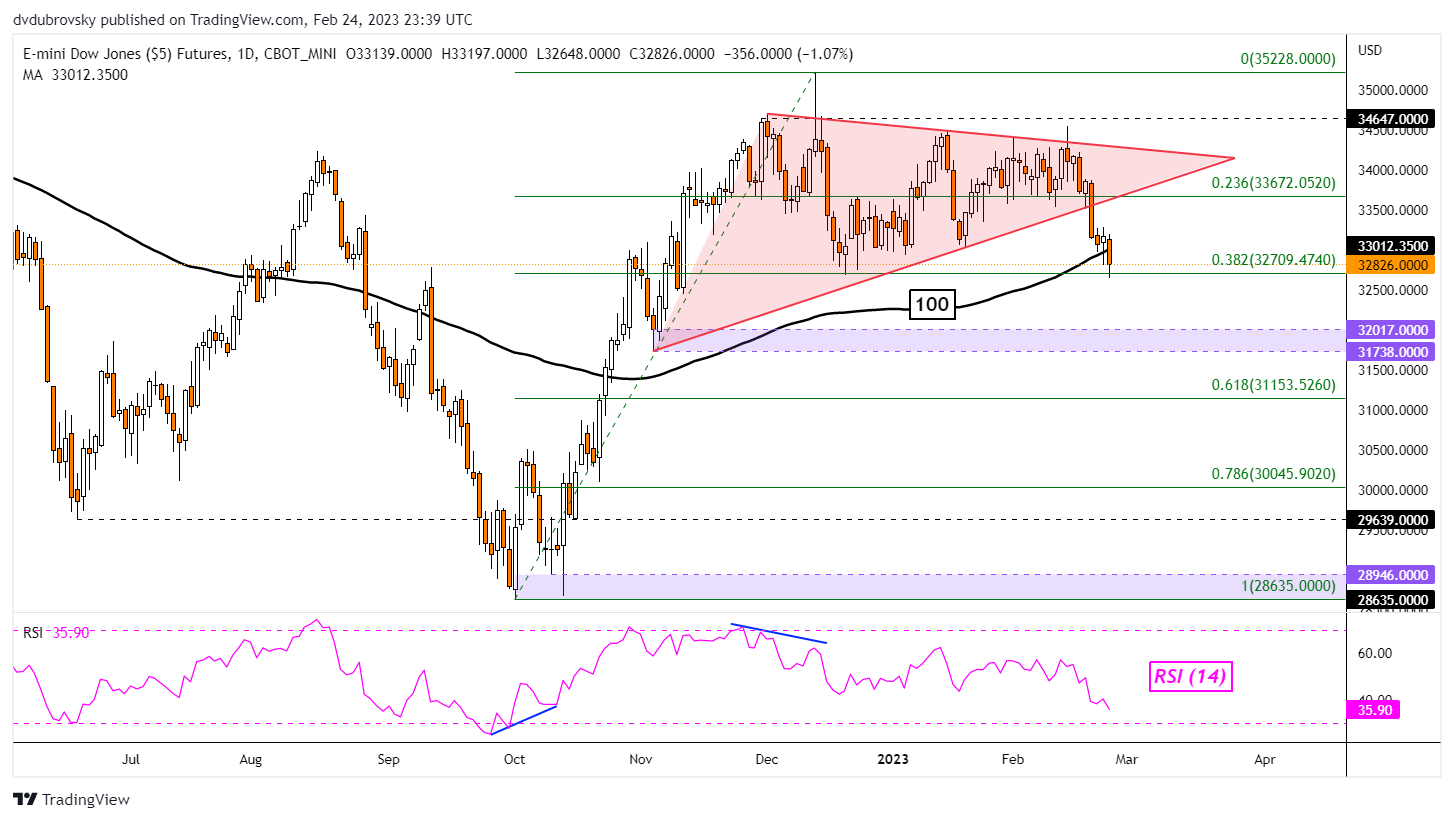
Dow Jones Outlook - Bearish
The Dow Jones may also be setting the stage for disappointment in the week ahead. That is because prices confirmed a breakout under a Symmetrical Triangle that has been brewing since October. But, last week, prices were unable to clear the 38.2% Fibonacci retracement level at 32709, which held as critical support and should be watched very closely.
What did break was the 100-day SMA. While confirmation is lacking, a further downside close would open the door to an increasingly bearish technical bias. Beyond that is the 31738 – 32017 support zone towards the 61.8% level at 31153. In the event of a turn higher, keep a close eye on the former floor of the triangle, which could hold as new resistance.
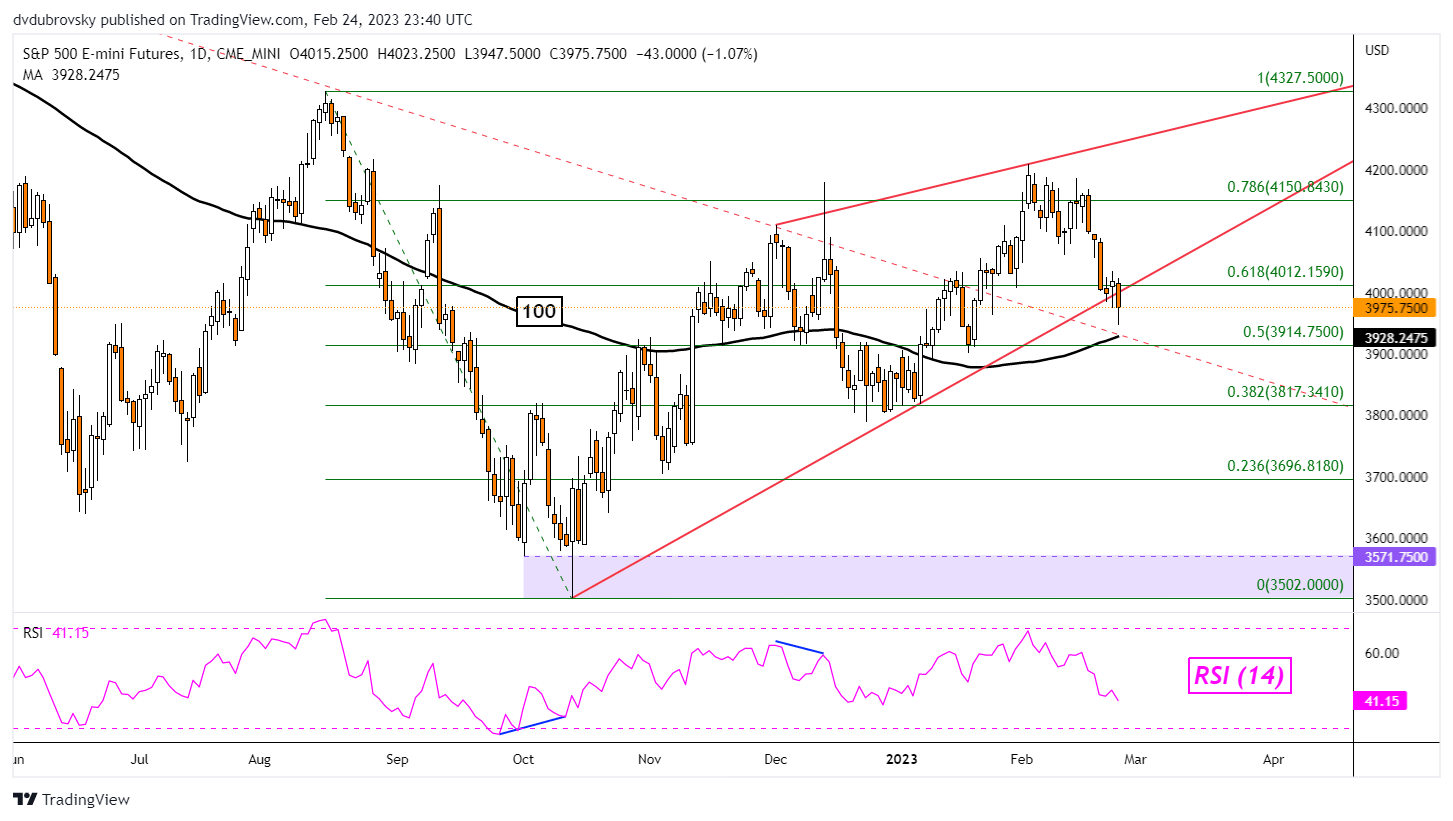
S&P 500 Outlook - Bearish
The S&P 500 may also be readying to extend losses in the week ahead. Last week, prices closed under the floor of a brewing bearish Rising Wedge chart formation since October. Granted, confirmation of the breakout was lacking. Immediate support appears to be the 100-day SMA. Pushing lower towards this point could offer an increasingly bearish view.
Extending lower exposes the 38.2% Fibonacci retracement level at 3817 towards the 23.6% point at 3696. Following the trajectory of the Rising Wedge could eventually see prices reach the 3571 – 3502 support zone. Otherwise, a climb back into the wedge would likely shift the focus to a more bullish setting, placing the focus on the 78.6% level at 4150.
Trade Smarter - Sign up for the DailyFX Newsletter
Receive timely and compelling market commentary from the DailyFX team
--- Written by Daniel Dubrovsky, Senior Strategist for DailyFX.com
To contact Daniel, follow him on Twitter:@ddubrovskyFX