


Japanese Yen, USD/JPY, US Dollar, Crude Oil, FOMC, Fed, Gold - Talking Points
- The Japanese Yen appears to be at a crossroads with lower oil prices
- The Fed minutes reminded markets that inflation is the key, not holding up equities
- If crude oil continues to go lower, will USD/JPY resume its downtrend?

The Japanese Yen clawed back prior session losses against the US Dollar today, as did crude oil.
Currency and commodity markets have started the year with a volatility breakout, with many markets whipsawing in the opening stanza of 2023. USD/JPY has recovered from Tuesday’s low of 129.51 to be back above 132 today.
Japan relies heavily on importing most of its energy and with crude oil down around 9% in the last few days, the Yen might be a beneficiary of the move.
The WTI futures contract nearing US$ 74 bbl while the Brent contract is approaching US$ 79 bbl.
Aside from the Yen, the US Dollar was crunched going into the New York close but has since pulled back some of those losses. The Aussie and Kiwi Dollars are the notable underperformers today.
Spot gold printed a new six-month high overnight at US$ 1,865 overnight and is steady at around US$ 1,850 at the time of going to print.
Treasury yields dipped lower in the US session but has added a few basis points across the curve so far through the Asian session. The benchmark 10-year note had looked below 1.70% but is now back above there.
The 10-year Australian Commonwealth Government Bond (ACGB) is near 3.85% having started the year above 4%. The same tenure Japanese Government Bond (JGB) is at 0.45% as the Bank of Japan continues with its yield curve control (YCC) program, capping its yield at 0.50%.
The Fed appears a bit flabbergasted with the market’s take on what rates will do this year. According to the Federal Open Market Committee (FOMC) meeting minutes released yesterday, rates are going to stay as high for as long as they need to be.
They cited the public’s unwarranted perception of their reaction function toward easing financial conditions in the event of an economic slowdown while inflation remains high.
On the data front, China’s Caixin PMI services index beat expectations for December at 48.0 instead of the 46.8 forecasts and 46.7 previously. The composite PMI was 48.3, higher than 46.7 prior.
APAC equities are mostly up on the day with Chinese and Hong Kong stock indices notching sizable gains. Australian and Japanese markets are mostly flat.
Looking ahead, the market will be looking at US jobs data later today to decipher the potential implications for the Fed at their next meeting in February.
The full economic calendar can be viewed here.

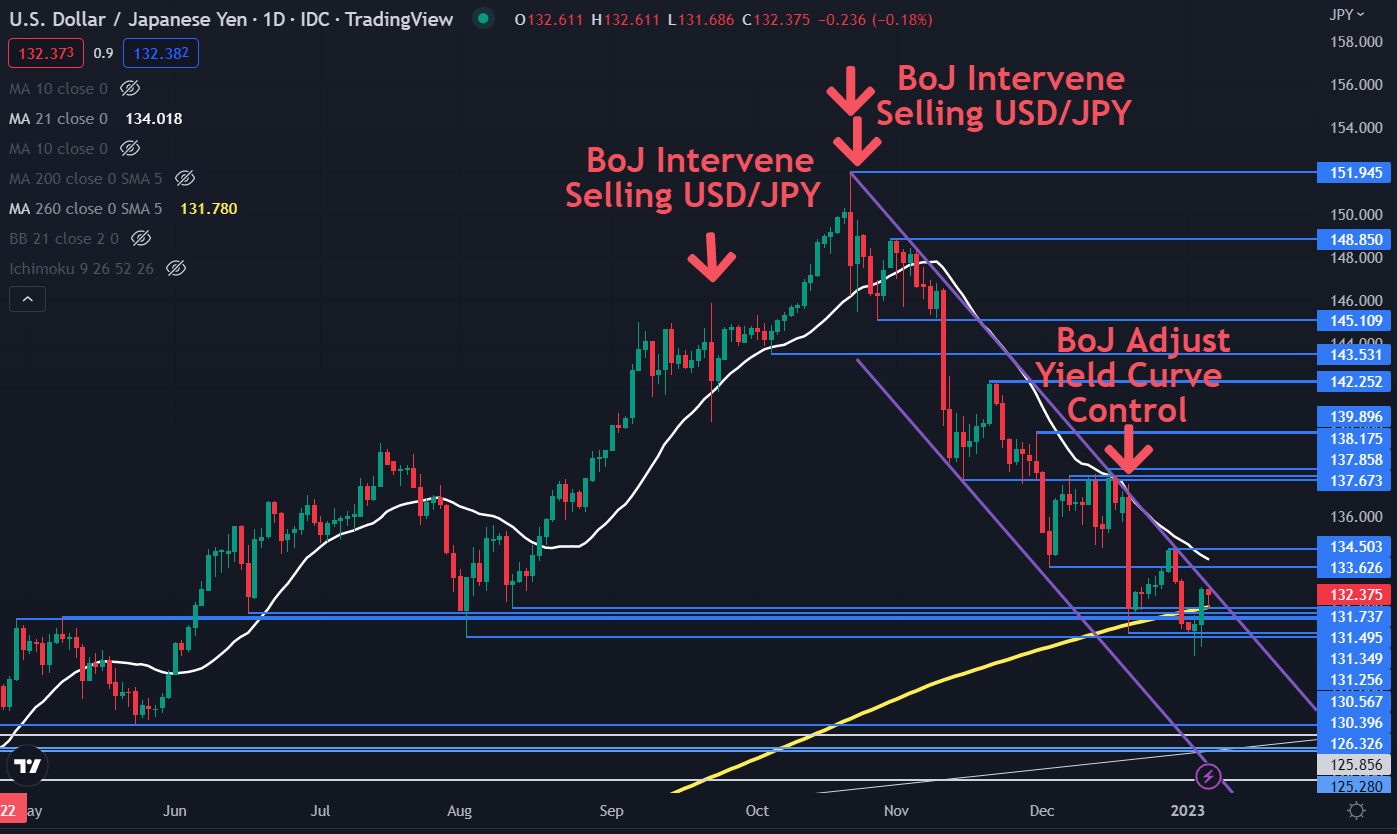
USD/JPY TECHNICAL ANALYSIS
USD/JPY remains within a descending trend channel, but it is currently testing the upper band. A decisive break above it may indicate an end to the trend.
In the event of a topside breakout, resistance might be offered in the 132.63 – 133.50 area with a breakpoint, 21-day simple moving average (SMA) and a prior peak in that zone.
On the downside, USD/JPY had a look below a cluster of previous lows and breakpoints within the 130.40 – 131.74 range when it made a low at 129.51.
It was unable to sustain the press lower and a clean break below that area might see bearishness re-accelerate. The 260-day SMA is amongst those levels at 130.78.
--- Written by Daniel McCarthy, Strategist for DailyFX.com
Please contact Daniel via @DanMcCathyFX on Twitter


