


Gold, Dollar, Fed Rates and Speculative Positioning Talking Points:
- The Market Perspective: Gold Bearish Below 1,730
- Gold managed to cap its four-day slide Tuesday just as the Dollar’s own rebound wavered
- However, in comparing the dominant fundamental themes at work, there is a distinctly strong correlation between the metal and Fed rate forecasts

The bearish reversal from gold that followed the successful hold of the 38.2 percent Fibonacci retracement of the March 8th peak high to November 3rd range low at approximately 1,790 seems to have run out of short-term steam. The four-day slide was fairly persistent given the standard consecutive day trends of the past 12 months, but the progress was somewhat wanting. Over that same period of retreat through Monday, the market had only lost -2.3 percent in altitude which is meaningfully smaller than four-session moves through early October, throughout September and other periods in 2022. Where the market semes to have found a temporary sense of balance, there doesn’t seem to be much in the way of high-profile technical precedence. The 38.2 percent Fib of the November rally is down at 1,722 while the 20 and 100-day simple moving averages are further down at 1,711. That lack of chart-based guideline can foster volatility, but – as with most markets – the potential for trend will be undermined by thinning liquidity heading into Thanksgiving.
Chart of Gold with 100 and 200-day SMAs (Daily)
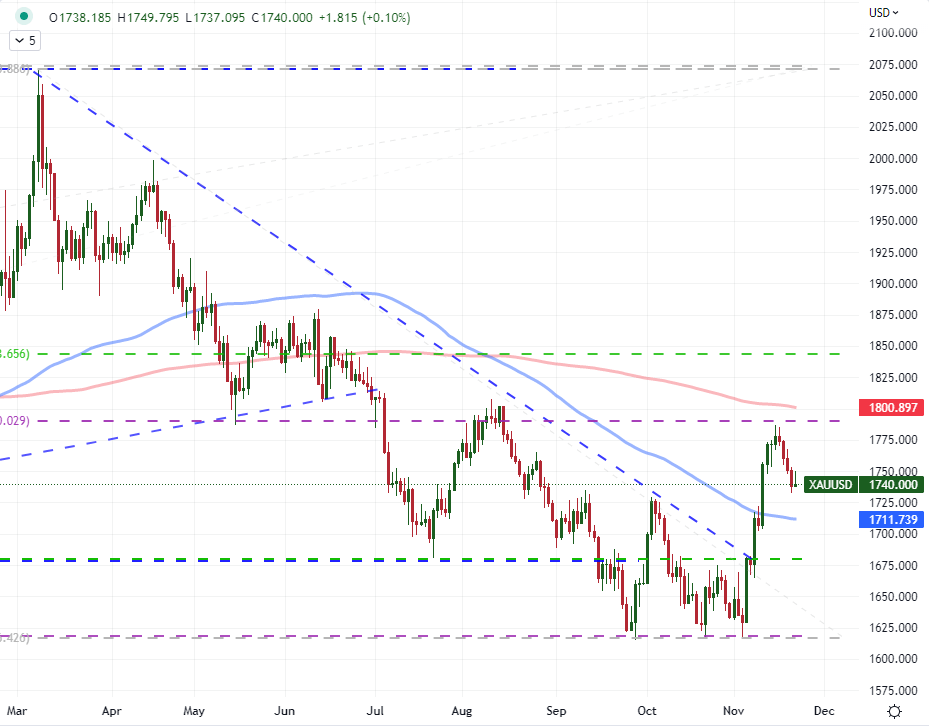
Chart Created on Tradingview Platform
Whether assessing the course of gold now or after the weekend as we move back into deeper waters, it is important to assess the most capable drivers for this market. While many still consider gold their preferred safe haven, the lack of correlation to traditional risk assets doesn’t offer much weight to that notion for me. Alternatively, the alignment of the metal to the Dollar is exceptionally high which is likely due to the fact that the currency is the principal pricing vehicle for the commodity. If that relationship holds, what motivates the USD is likely to provide a mirror performance from gold. At present, the most prolific driver I have been monitoring seems to be Fed rate forecasts. Below we can see the strong general correlation between gold and the implied rate forecast for the Fed through June of next year. The deviation just in these past few weeks – particularly after the US CPI release – suggests there may be an eventual convergence. Yet, is the Fed going to relent or gold traders?
Chart of Gold Overlaid with Inverted Fed Forecast through June 2023 (Daily)
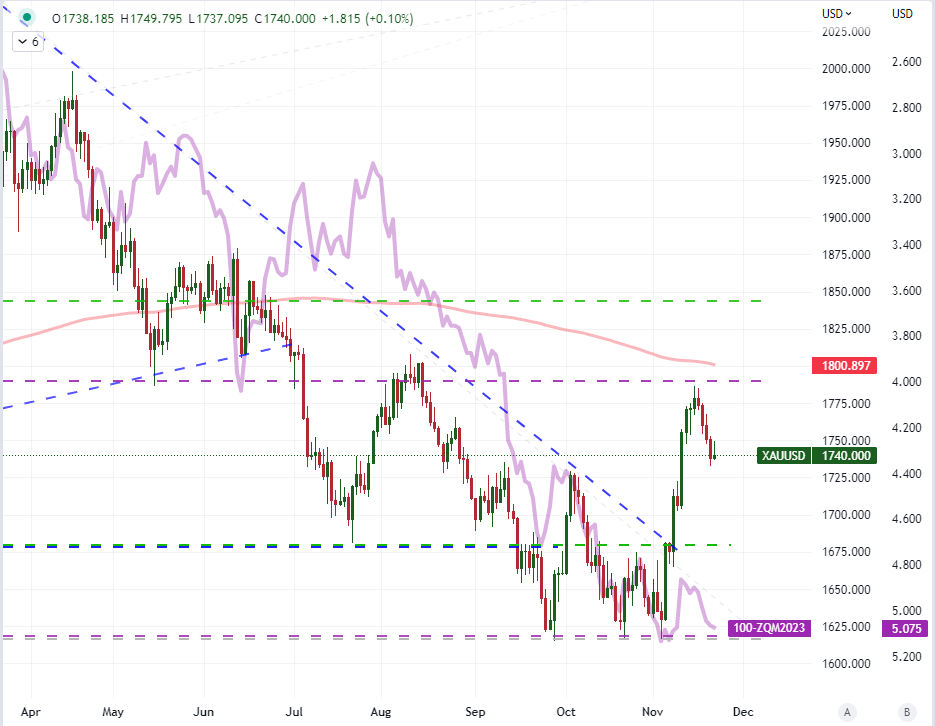
Chart Created on Tradingview Platform
Another macro theme that is worth monitoring is the risk of recession for the United States and the globe more broadly. If the economy is going to sharply slow or contract – as was implied by the OECD just this past session with their updated forecasts – then it would suggest that there will be a heightened appetite for gold as a safe haven. That said, there was little risk aversion to be found on the day. Furthermore, the same group’s inflation forecasts were revised higher for 2023 which would further insinuate that progressive rate hikes will be promoted. That creates a problem for a commodity like gold that provides no yield. For a comparison of gold to ebb and flow of economic activity, I have the US 10-year to 2-year Treasury yield spread for comparison on the weekly chart. There isn’t a strong relationship; and what may arise for correlation may be more happenstance owing to somewhat related factors – like rate hikes.
| Change in | Longs | Shorts | OI |
| Daily | 6% | -10% | -2% |
| Weekly | 1% | -11% | -4% |
Chart of Gold Overlaid with US 2-10 Yield Spread and COT Net Spec Futures Positioning (Weekly)
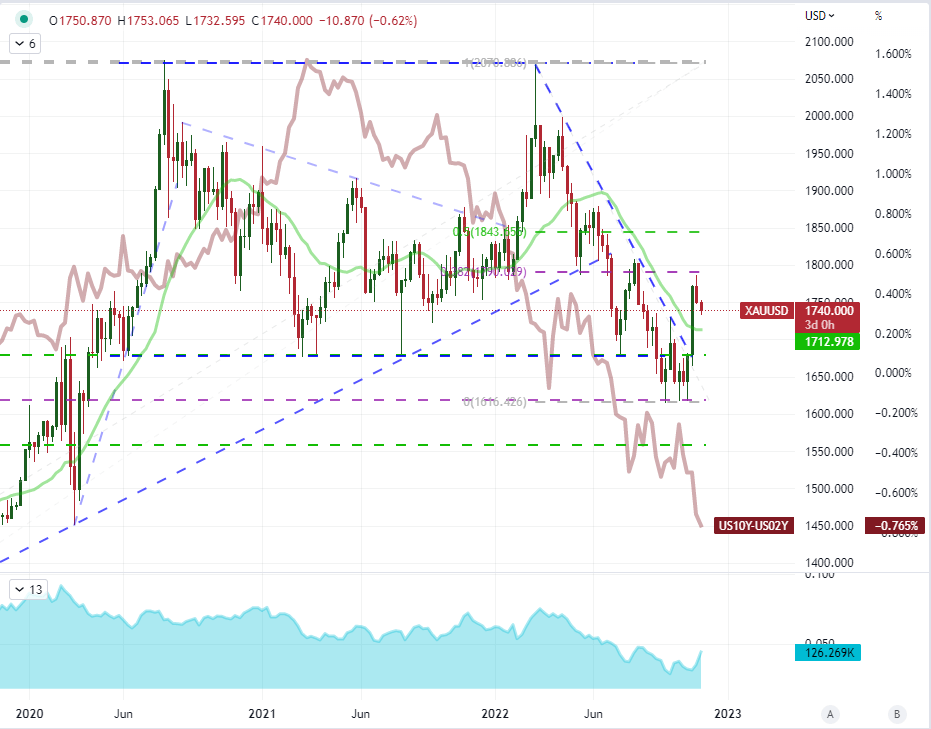
Chart Created on Tradingview Platform
Trade Smarter - Sign up for the DailyFX Newsletter
Receive timely and compelling market commentary from the DailyFX team


