


Gold, XAU/USD, US Debt Ceiling, Technical Analysis - Briefing:
- Gold prices fell on Wednesday, extending recent losing streak
- US debt ceiling breakthrough bets pushed up Treasury yields
- XAU/USD faces support breakout and a bearish IGCS signal

Gold prices weakened on Thursday, extending a recent string of losses for the yellow metal. This week is shaping up to be a 1.45% decline for XAU/USD. If confirmed, this would be the worst 5-day period since the end of February. Let us take a closer look at what is going on and what we could expect going forward.
Gold is an anti-fiat trading unit. Its top has been associated almost perfectly with a bottom in the 2-year Treasury yield. The latter has rallied almost 10% since finding support earlier this month. Meanwhile, the US Dollar has also been rallying for the past few weeks.
Long story short, recent economic updates from the US have been pouring cold water on near-term Fed rate cut bets. Over the past 24 hours, financial markets seemed to enjoy prospects that a breakthrough could be in store for a bipartisan maneuver in Washington to raise the US debt ceiling, avoiding default.
With that in mind, if the rosy sentiment persists for financial markets, gold could be left vulnerable over the remaining 24 hours. All eyes will then turn to Thursday’s US initial jobless claims report. This is some of the timeliest data there is on the status of the US labor market amidst rising interest rates.
XAU/USD Daily Chart
Gold continues to make downside progress in the aftermath of a Shooting Star candlestick chart pattern. The anti-fiat yellow metal has just barely closed under the 50-day Simple Moving Average (SMA). Further downside confirmation could spell trouble, exposing the 100-day equivalent.

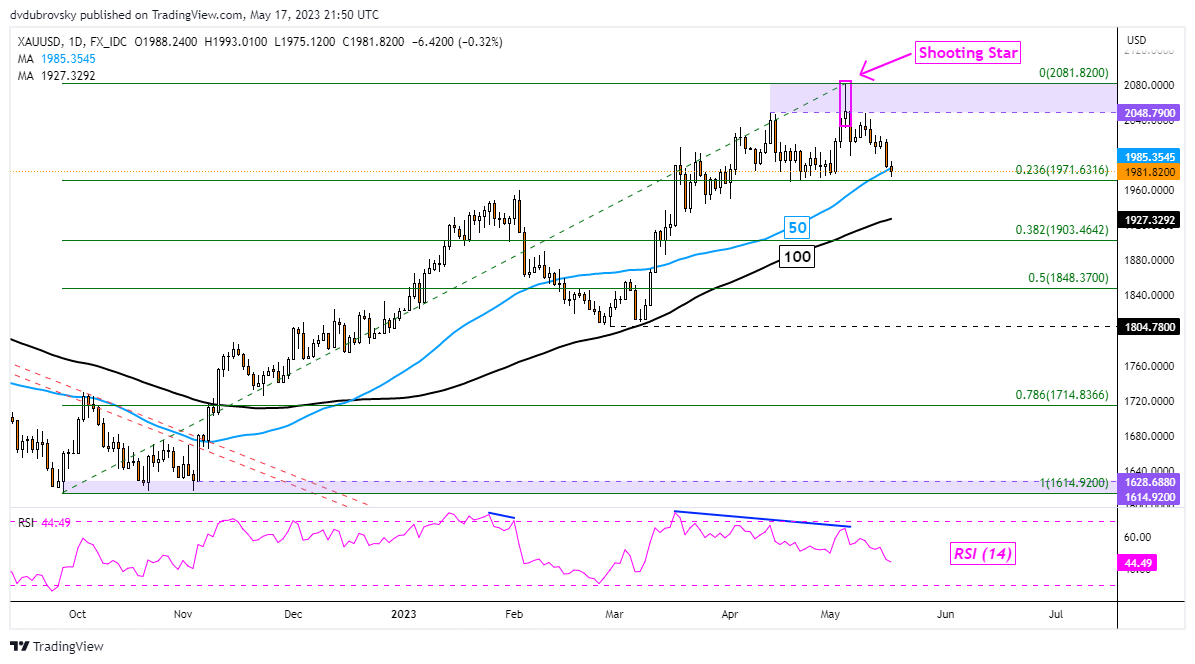
Chart Created Using TradingView
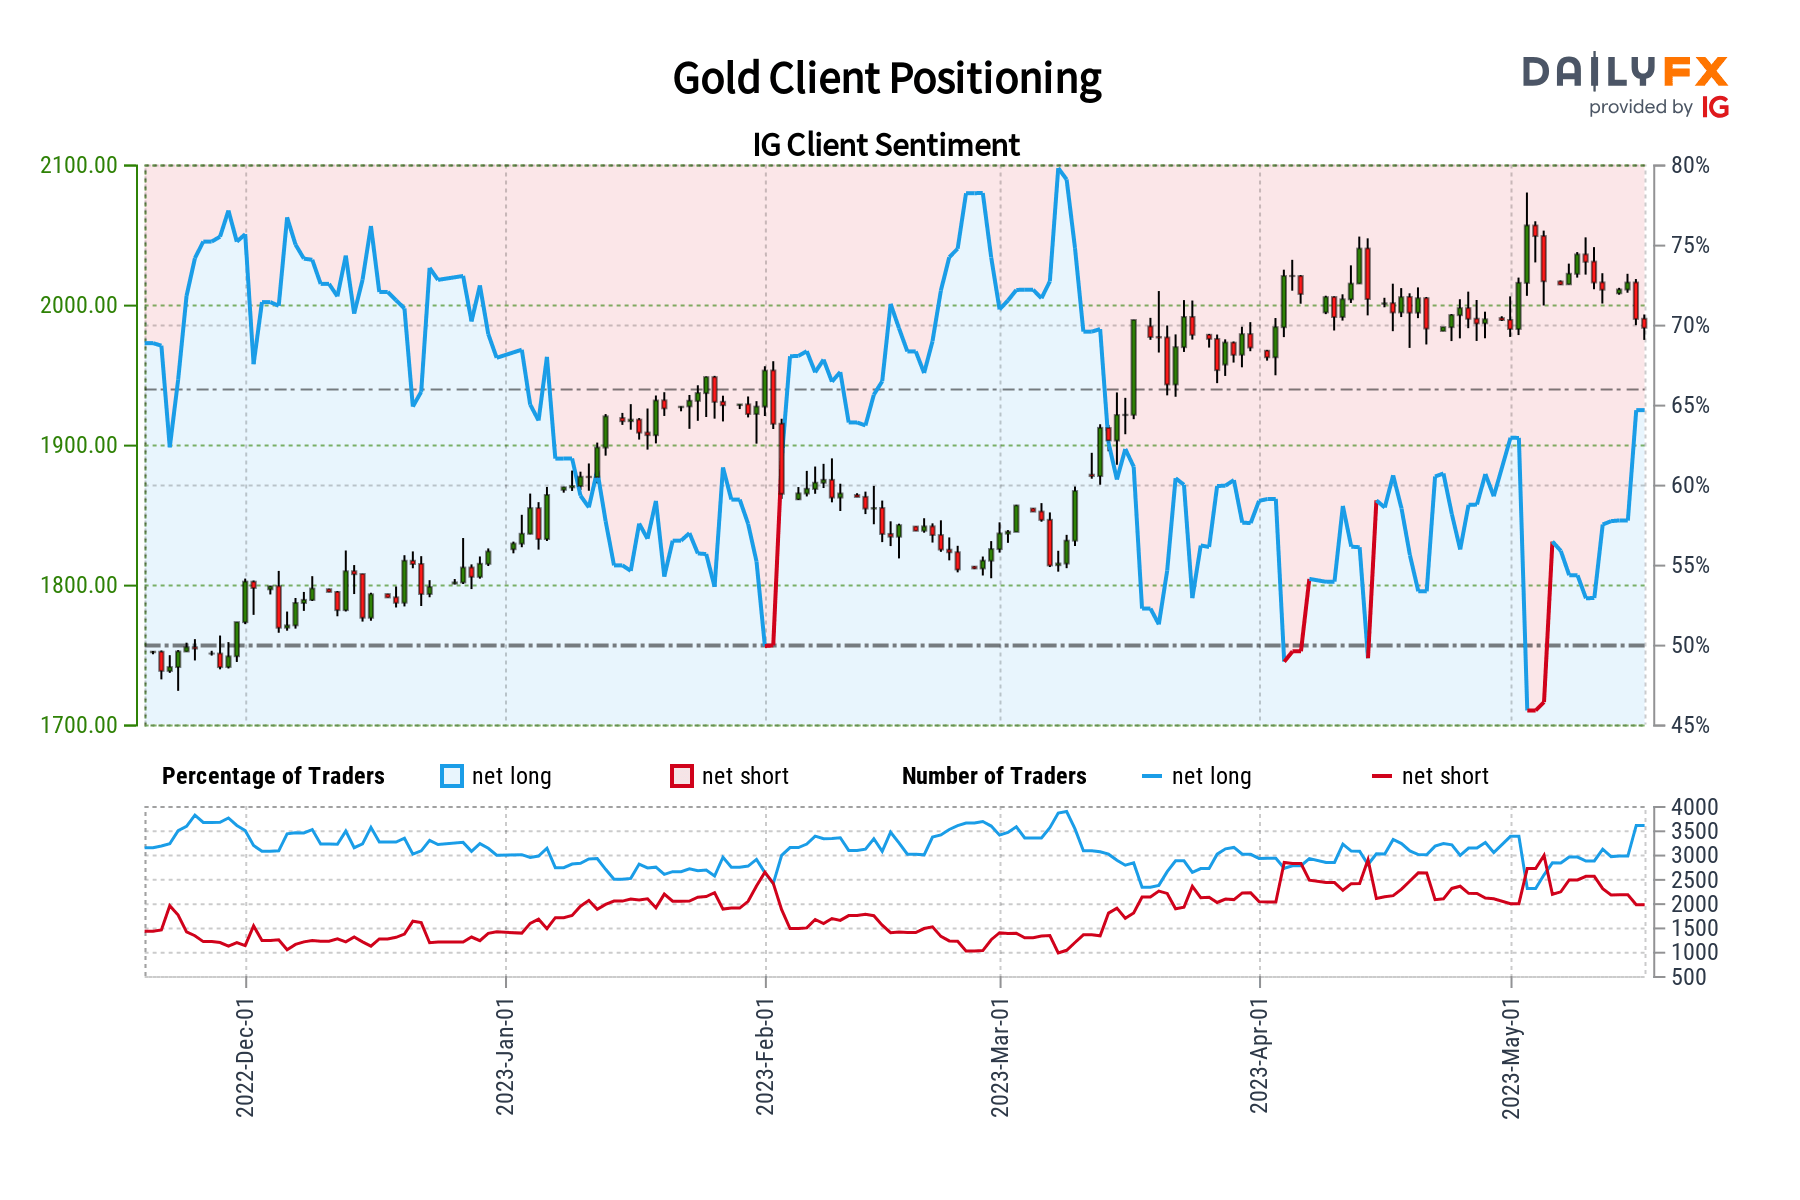
Gold Sentiment Analysis - Bearish
According to IG Client Sentiment (IGCS), about 64% of retail traders are net-long gold. IGCS tends to function as a contrarian indicator. With that in mind, since most traders are net-long this hints prices may continue falling. This is as upside exposure increased by 10.93% and 23.31% compared to yesterday and last week, respectively. With that in mind, recent changes in exposure offer a stronger bearish contrarian trading bias.
--- Written by Daniel Dubrovsky, Senior Strategist for DailyFX.com


