


Gold Price Talking Points
The price of gold remains under pressure after failing to defend the opening range for October, and bullion may fall towards the April 2020 low ($1568) if it fails to hold above the yearly low ($1615).
Gold Price to Fall Towards April 2020 Low on Failure to Defend Yearly Low
The price of gold appears to be tracking the negative slope in the 50-Day SMA ($1702) as it trades to a fresh monthly low ($1628), and the weakness in the precious metal looks poised to persist as longer-dated US Treasury yields climb to fresh yearly highs.
It seems as though the Federal Reserve’s hiking-cycle will continue to influence the price of gold as Chairman Jerome Powell and Co. pursue a restrictive policy, and bullion may trade to fresh yearly lows ahead of the next interest rate decision on November 2 as the central bank is expected to retain its existing approach in combating inflation.
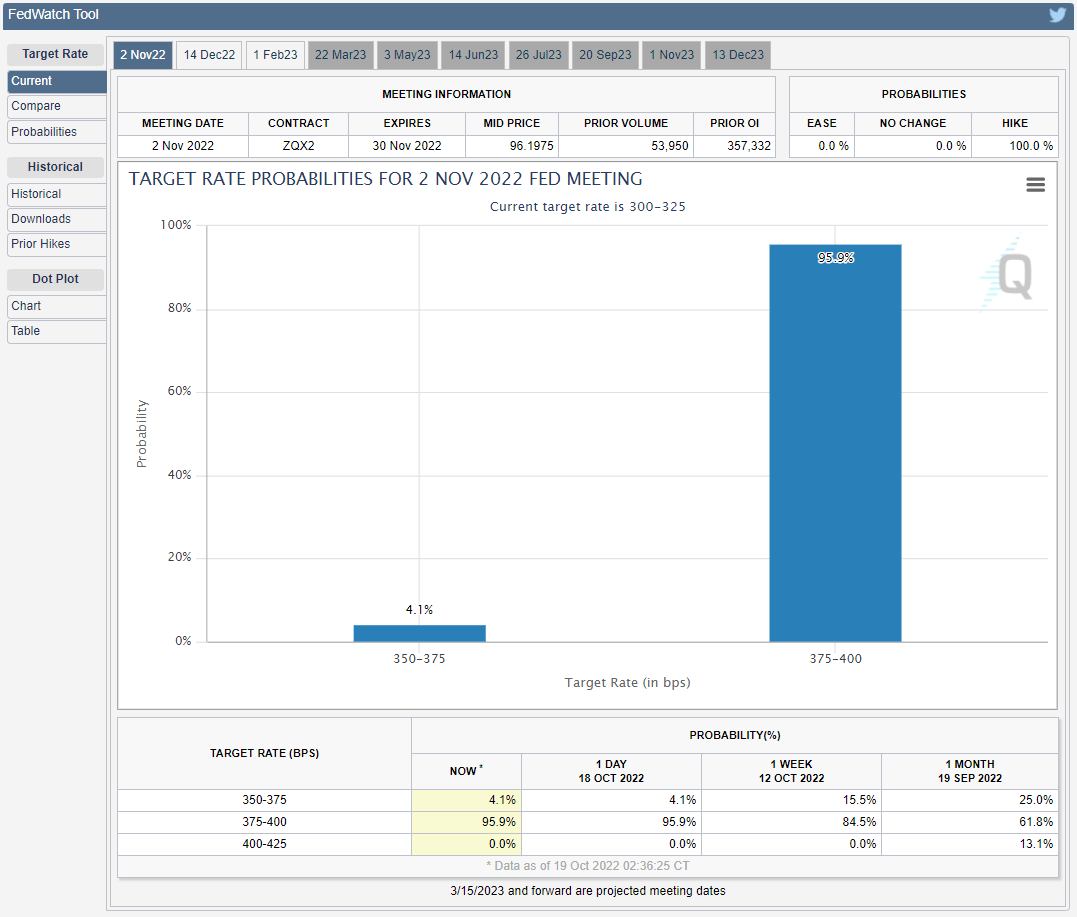
Source: CME
The CME FedWatch Tool still reflects a greater than 90% probability for another 75bp rate hike as the update to the US Consumer Price Index (CPI) points to sticky inflation, and the price of gold may continue to reflect an inverse relationship with Treasury yields as long as the Federal Open Market Committee (FOMC) sticks to its hiking-cycle.
In turn, bullion may largely mirror the price action from August as it continues to fall back from the moving average, and the price of gold may trade to fresh yearly lows throughout the remainder of the year as the Fed’s Summary of Economic Projections (SEP) show a steeper path for US interest rates.
With that said, speculation for another 75bp Fed rate hike may keep the price of gold under pressure, and the precious metal may fall towards the April 2020 low ($1568) if it fails to hold above the yearly low ($1615).
Gold Price Daily Chart
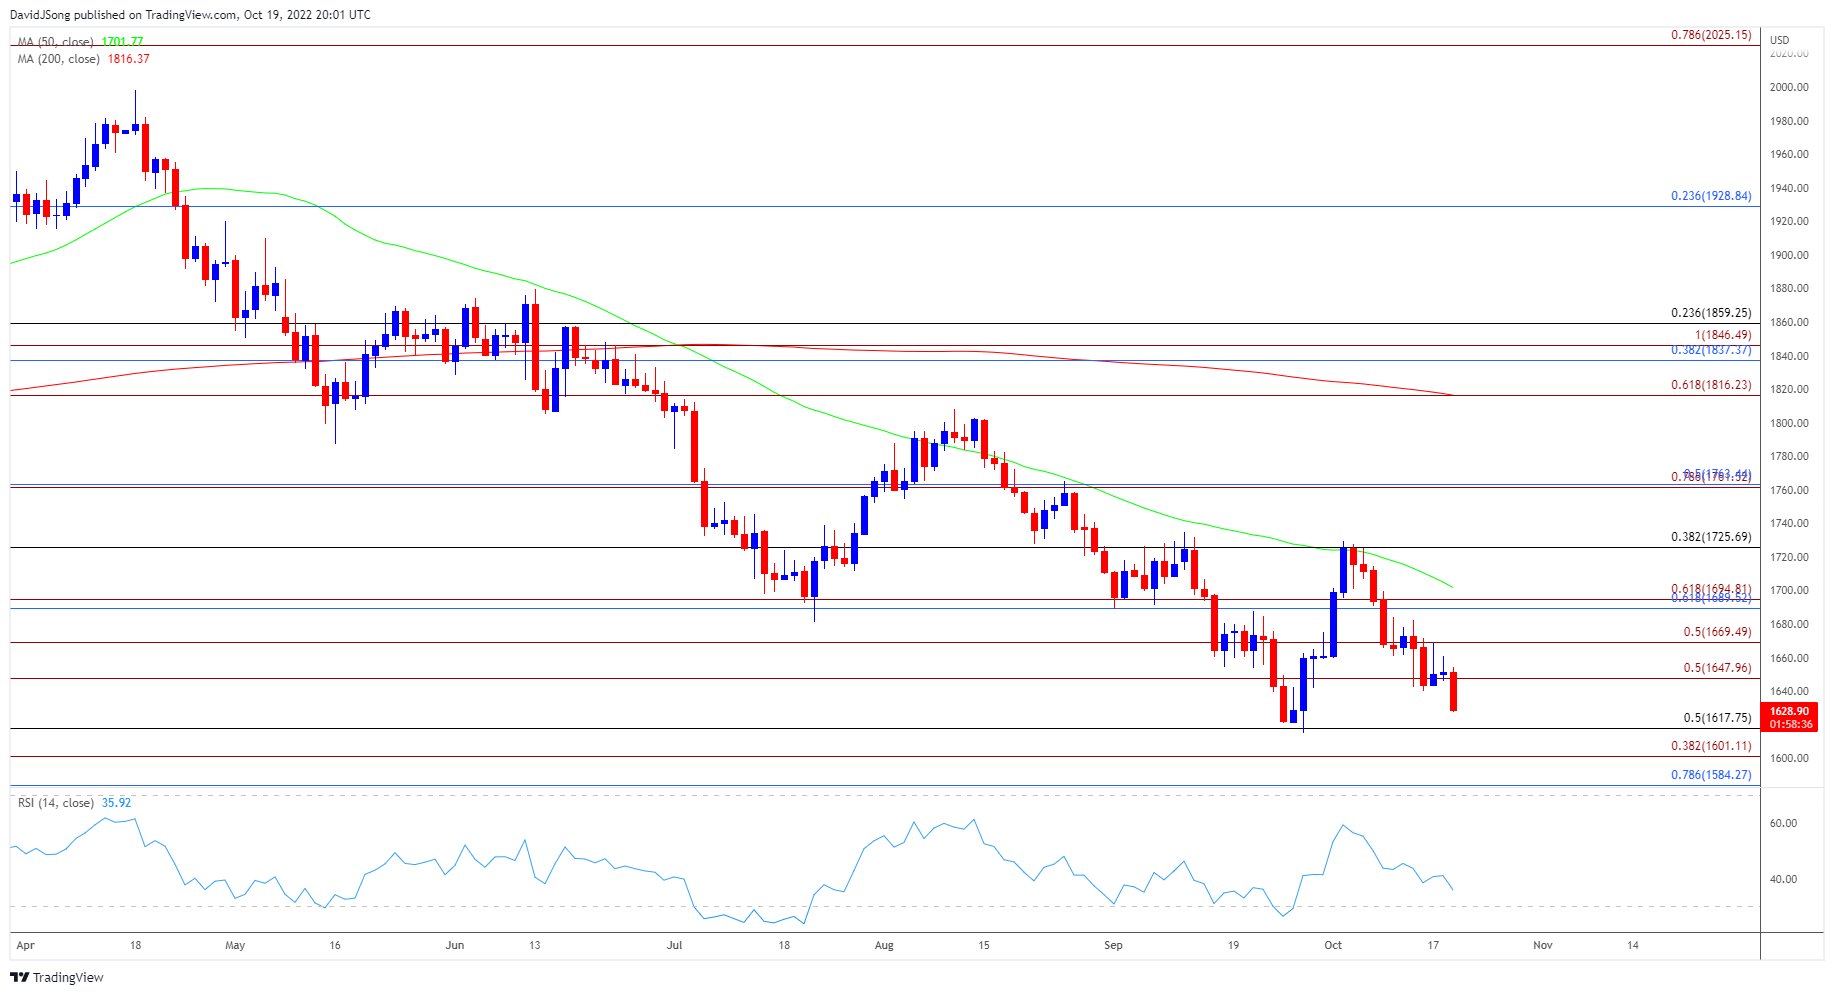
Source: Trading View
- The price of gold continues to push to fresh monthly lows after failing to defend the opening range for October, and the exchange rate may largely mirror the price action from August as it appears to be tracking the negative slope in the 50-Day SMA ($1702).
- The price of gold appears to be on track to test the yearly low ($1615) as it snaps the range bound price action from earlier this week, but need a close below the $1648 (50% expansion) region to bring the Fibonacci overlap around $1601 (38.2% expansion) to $1618 (50% retracement) on the radar.
- Lack of momentum to hold above the 1584 (78.6% retracement) area may lead to a test of the April 2020 low ($1568), but failure to clear the yearly low ($1615) may keep the price of gold within the September range.
Trading Strategies and Risk Management
Becoming a Better Trader
Recommended by David Song
--- Written by David Song, Currency Strategist
Follow me on Twitter at @DavidJSong


