


Gold Price (XAU/USD), Chart, and Analysis
- Gold rejected at resistance.
- Traders pare back their long gold bets.

A weaker US dollar and lower US interest rate expectations have given gold a boost over the past week and seen the precious metal rally over $100/oz. in the process. Some weaker than expected US data, including last week’s ISM services report and yesterday’s JOLTs release, have fueled the belief that the Fed may have to pare back the size and speed of their rate hikes as liquidity and growth fears haunt the market.
Trade Smarter - Sign up for the DailyFX Newsletter
Receive timely and compelling market commentary from the DailyFX team
US Treasury yields have backed up over the last week with the interest-rate sensitive 2-year UST now offered with a yield of 4.14%, up around 13bps over the last two sessions but down from a 4.36%, multi-year peak. Higher US interest rates weigh on non-interest-bearing gold.
US Treasury 2-Year Yield – October 5, 2022
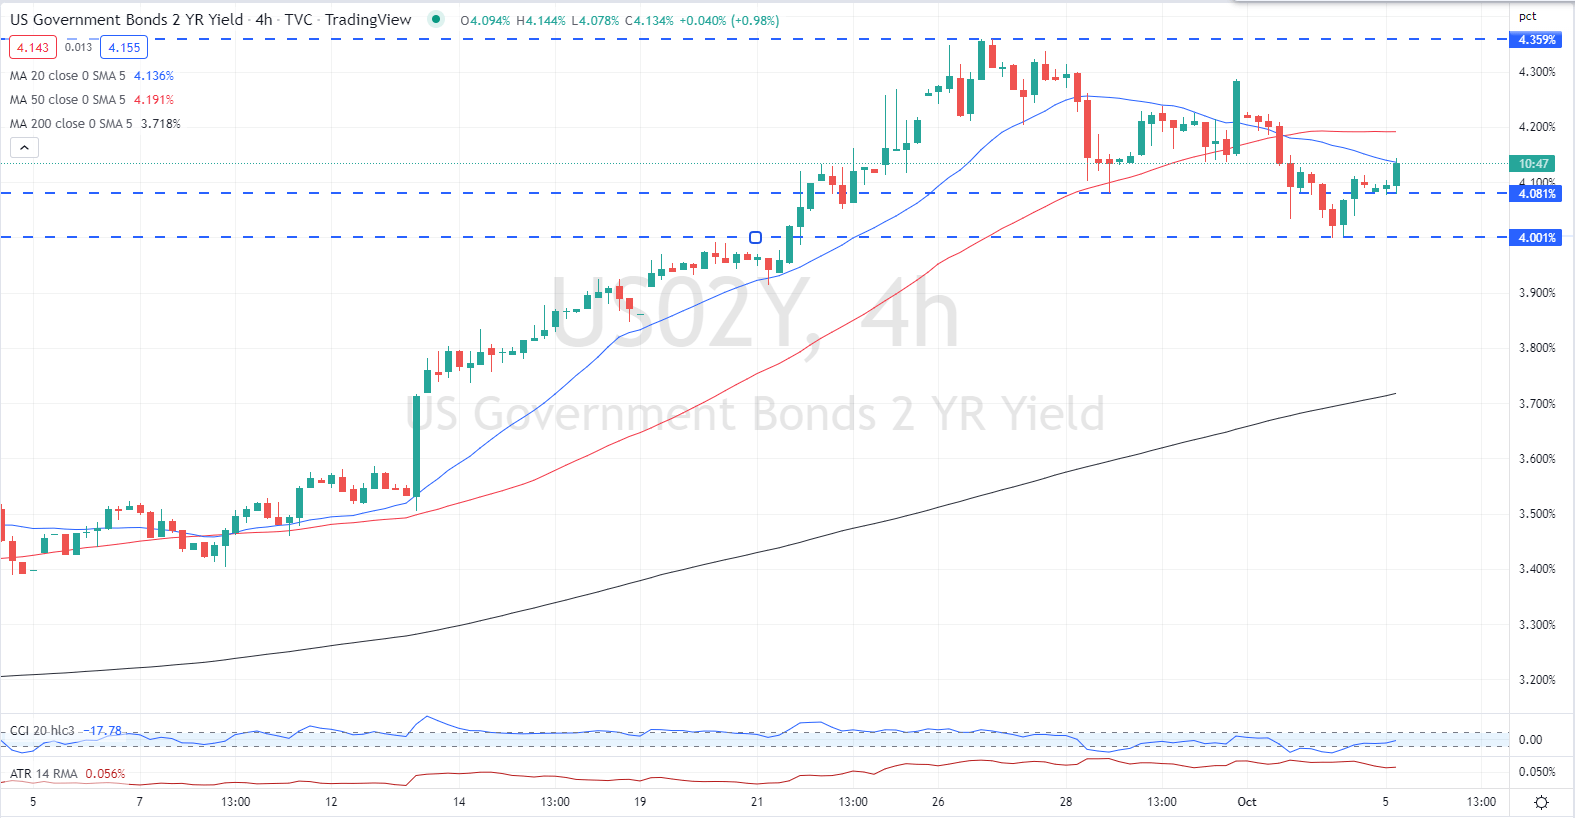
Chart via TradingView
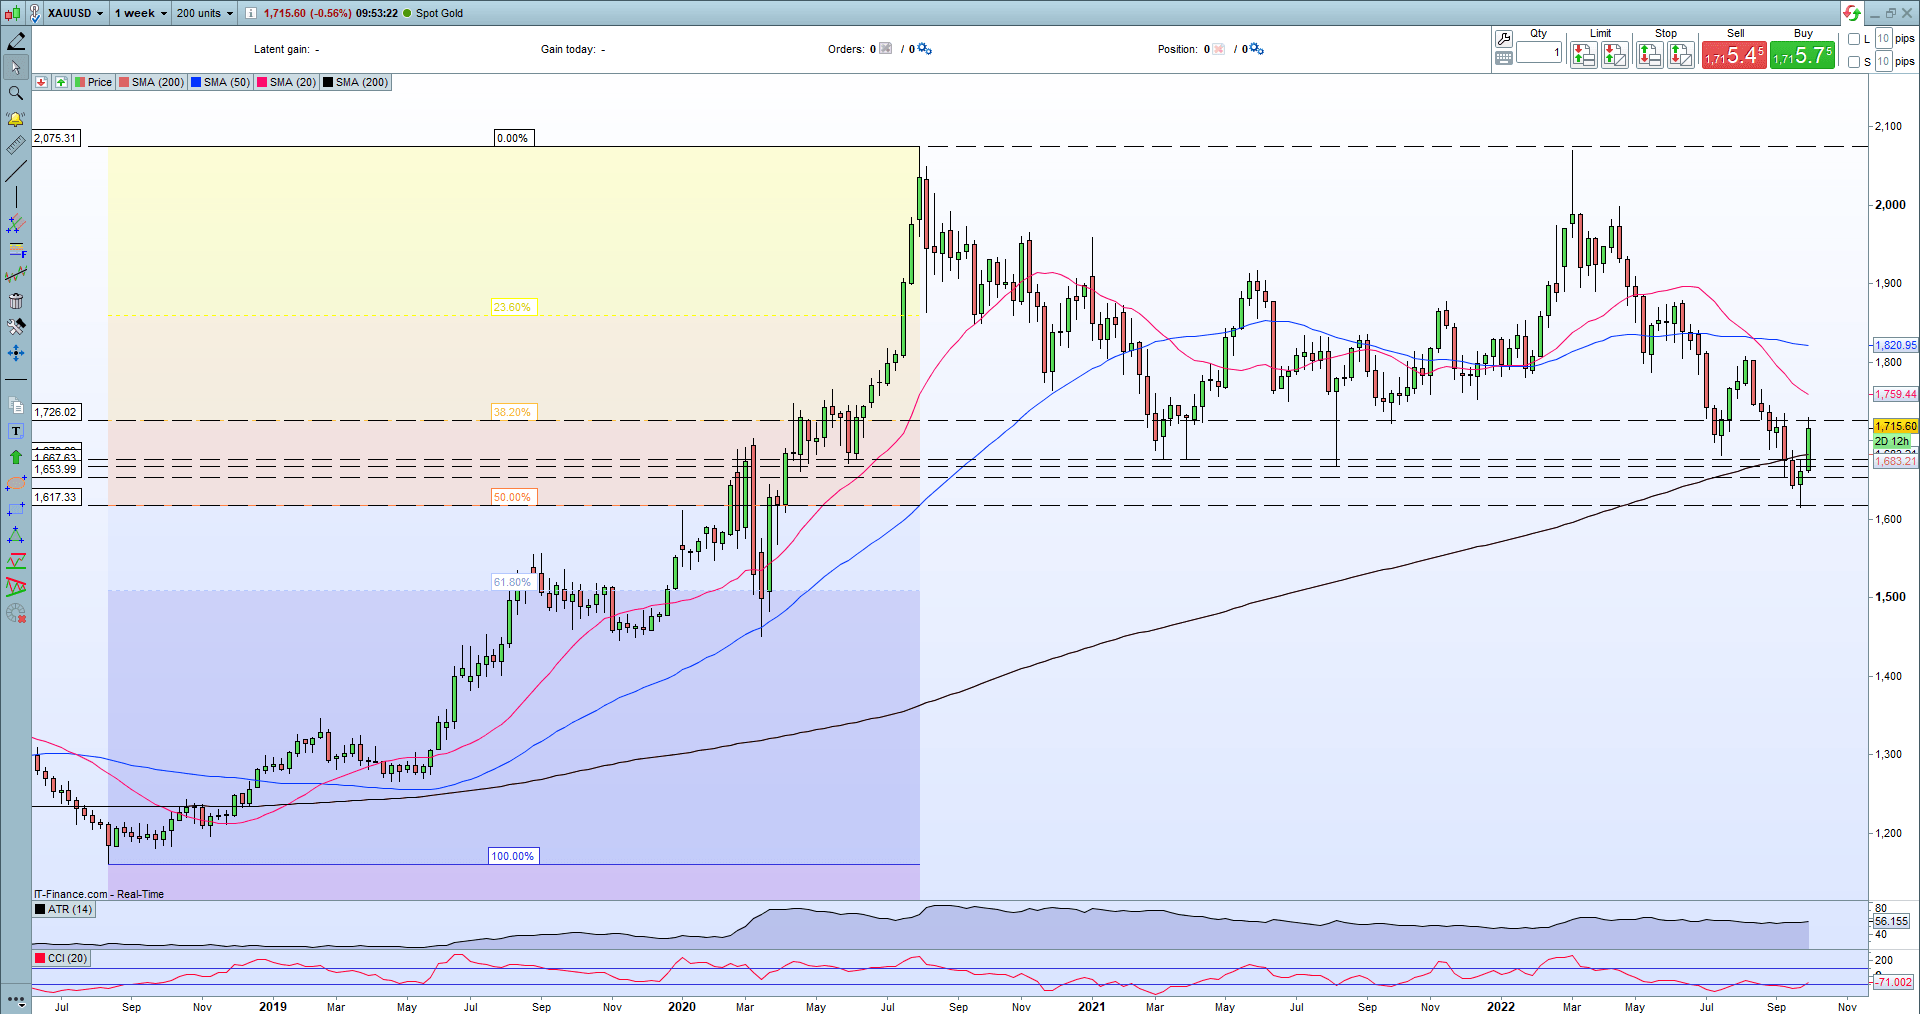
The weekly gold chart shows the precious metal respecting two Fibonacci retracements levels. The 50% Fib retracement level at $1,617/oz. held the recent sell-off and prompted a sharp rebound, while the 38.2% Fib retracement at $1,726/oz. held Tuesday’s test. These two levels are likely to remain active in the coming days.
Gold Weekly Price Chart – October 5, 2022
Later today we have the US non-manufacturing ISM release (15:00 BST) with forecasters expecting a slower rate of expansion compared to last month. The US economic calendar is very light on Thursday, while Friday sees the release of the monthly US jobs report (NFP) at 13:30 BST. The US government is trying to temper the jobs market without prompting a large rise in the unemployment rate – currently 3.7% - and a slowdown in non-farm payrolls this month would be welcomed by the Fed.
For all market-moving data releases and events, see the DailyFX Economic Calendar.
Retail Traders Cut Long Positions, Increase Short Positions
Retail trader data show 73.94% of traders are net-long with the ratio of traders long to short at 2.84 to 1.The number of traders net-long is 6.91% lower than yesterday and 16.68% lower from last week, while the number of traders net-short is 2.10% higher than yesterday and 33.13% higher from last week.
We typically take a contrarian view to crowd sentiment, and the fact traders are net-long suggests Gold prices may continue to fall. Yet traders are less net-long than yesterday and compared with last week. Recent changes in sentiment warn that the current Gold price trend may soon reverse higher despite the fact traders remain net-long.
| Change in | Longs | Shorts | OI |
| Daily | 1% | -1% | 0% |
| Weekly | -1% | -6% | -4% |
What is your view on Gold – bullish or bearish?? You can let us know via the form at the end of this piece or you can contact the author via Twitter @nickcawley1.


