


Gold, XAU/USD, FOMC, Fed, US Dollar, Crude Oil, WTI, Yields - Talking Points
- The gold price appears to be fortifying its position above US$ 2,000 for now
- Treasury yields crude oil prices have displayed an inverse relationship with the metal
- US CPI on Wednesday might provide hints on Fed policy. Will it drive XAU/USD?
Trade Smarter - Sign up for the DailyFX Newsletter
Receive timely and compelling market commentary from the DailyFX team
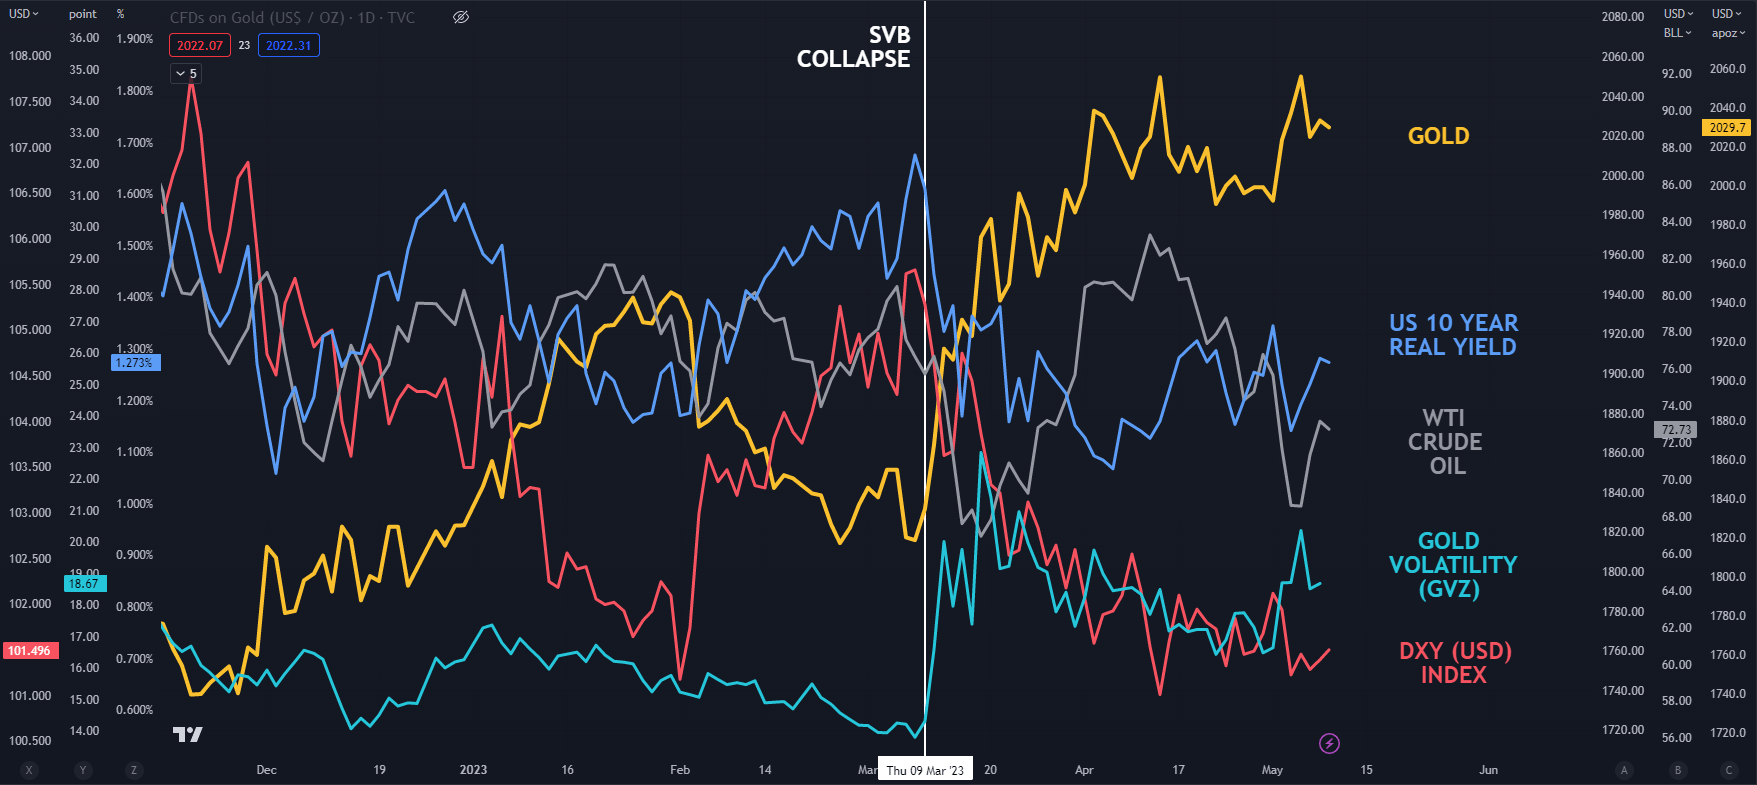
Gold consolidated around the US$ 2,020 handle going into Tuesday’s trading session after dipping last Friday as sways in risk sentiment appear to be driving the pricing of the precious metal.
Treasury yields have ticked higher across the curve since the Federal Open Market Committee (FOMC) raised its target rate by 25 basis points to 5-5.25% last week.
The benchmark 2-year note traded as low as 3.66% last Thursday but has nudged up to 4% today.
On the same day that Treasury yields bounced higher from their lows, gold made its 33-month peak at US$ 2,085.4 on the COMEX futures exchange before sliding lower since.
Similarly, real yields also appear to have moved with an inverse correlation to the yellow metal of late. The 10-year rate touched 1.29% overnight, well above the low of 1.11% seen last week.
The real yield is the nominal yield less the market-priced inflation rate derived from Treasury inflation-protected securities (TIPS) for the same tenor.
WTI crude oil also reflects this inverted price action as the market awaits Wednesday’s US CPI data for clues on the Fed’s rate path going forward. A Bloomberg survey of economists is anticipating headline inflation of 5.0% year-on-year to the end of April.
With the retreat in the gold price, volatility also backtracked lower. The GVZ index measures gold volatility in a similar way that the VIX index measure volatility on the S&P 500.

GC1 (GOLD FUTURES) WTI CRUDE OIL, US 10-YEAR REAL YIELD, GOLD VOLATILITY, USD
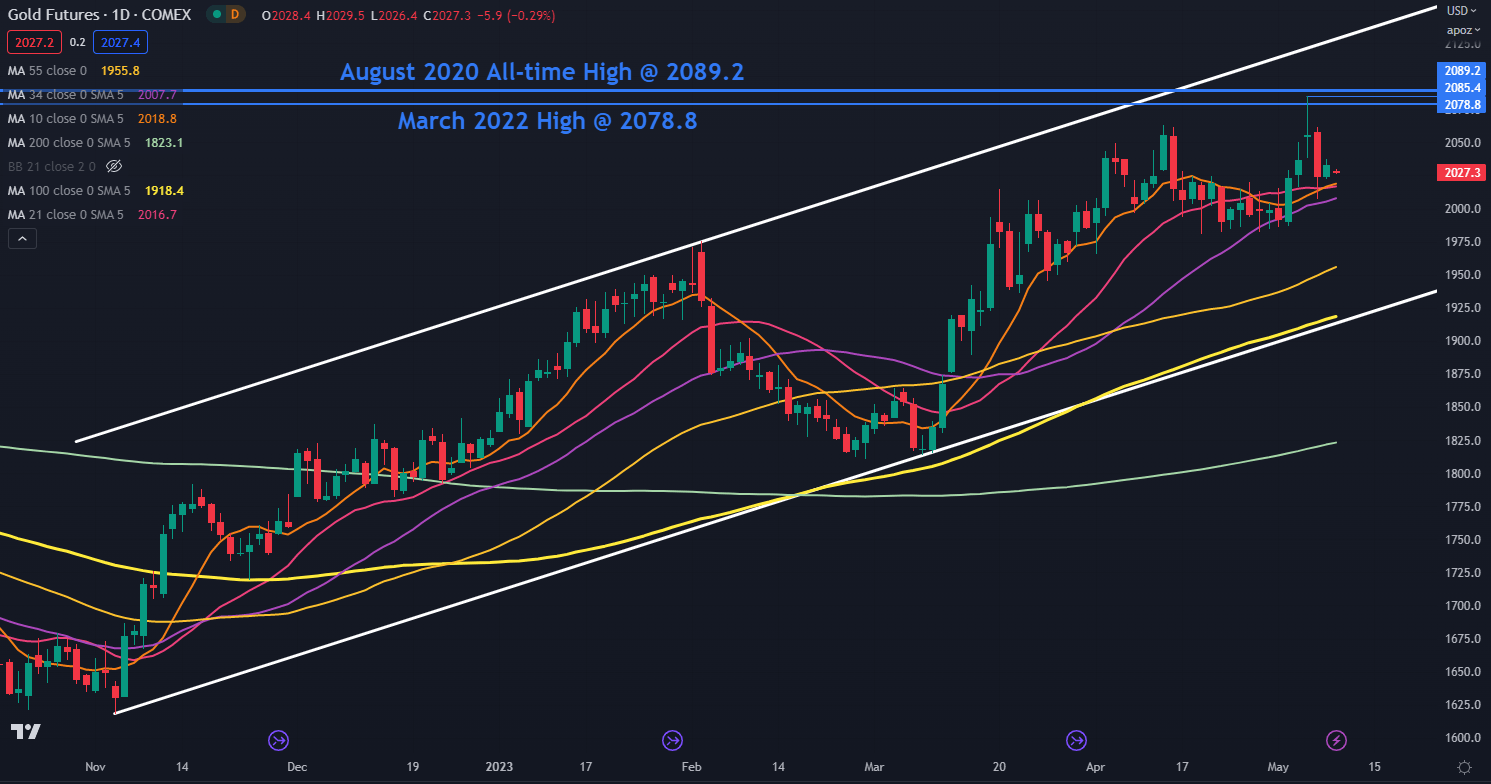
GC1 (GOLD FRONT FUTURES CONTRACT) TECHNICAL ANALYSIS
Gold remains in an ascending trend channel that began in November last year.
Last week’s high of 2085.4 cleared the March 2022 peak of 2078.8 but fell short of overcoming the all-time high of 2089.2. This may indicate that the 2080 – 2090 area might offer a resistance zone.
A break above there may open the way for a test of the ascending trend line, currently dissecting at 2130.
A bullish triple moving average (TMA) formation requires the price to be above the short-term Simple Moving Average (SMA), the latter to be above the medium-term SMA and the medium-term SMA to be above the long-term SMA. All SMAs also need to have a positive gradient.
The price action this week has seen the 10-day SMA cross above the 21-day SMA and the 200-day SMA cross above the 260-dat SMA. These are known as Golden Crosses.
This development means that looking at any combination of daily SMAs, the criteria for a TMA have been met. A close in price below any SMA will invalidate the TMA.
On the downside, support might be provided at the prior lows of 1980.9, 1945.0 and 1936.5 ahead of the ascending trend that currently lies at 1915. The 100-day SMA is near that trend line and could add support near there.
--- Written by Daniel McCarthy, Strategist for DailyFX.com
Please contact Daniel via @DanMcCathyFX on Twitter


