


GOLD PRICE FORECAST:
- Gold prices slump on Monday amid strong U.S. dollar and fears that the Fed will follow through on its plans to hike interest rates aggressively at upcoming FOMC meetings
- The fundamental outlook remains bearish for non-yielding precious metals
- The September U.S. inflation report could be the next big catalyst for XAU/USD in the coming days
Gold prices slumped at the start of the week, weighed down by the rising U.S. dollar and fears that the Federal Reserve will retain a hawkish monetary policy stance amid resilient U.S. economic activity. At the time of writing, XAU/USD was down about 2% to $1,674, extending last Friday's losses and hitting a seven-day low.
The robust jobs report released before the weekend, which showed U.S. employers added 263,000 workers in September, versus the 250,000 forecasted, helped cement expectations on Wall Street for another three-quarter point hike at the November FOMC meeting (see chart below for details).
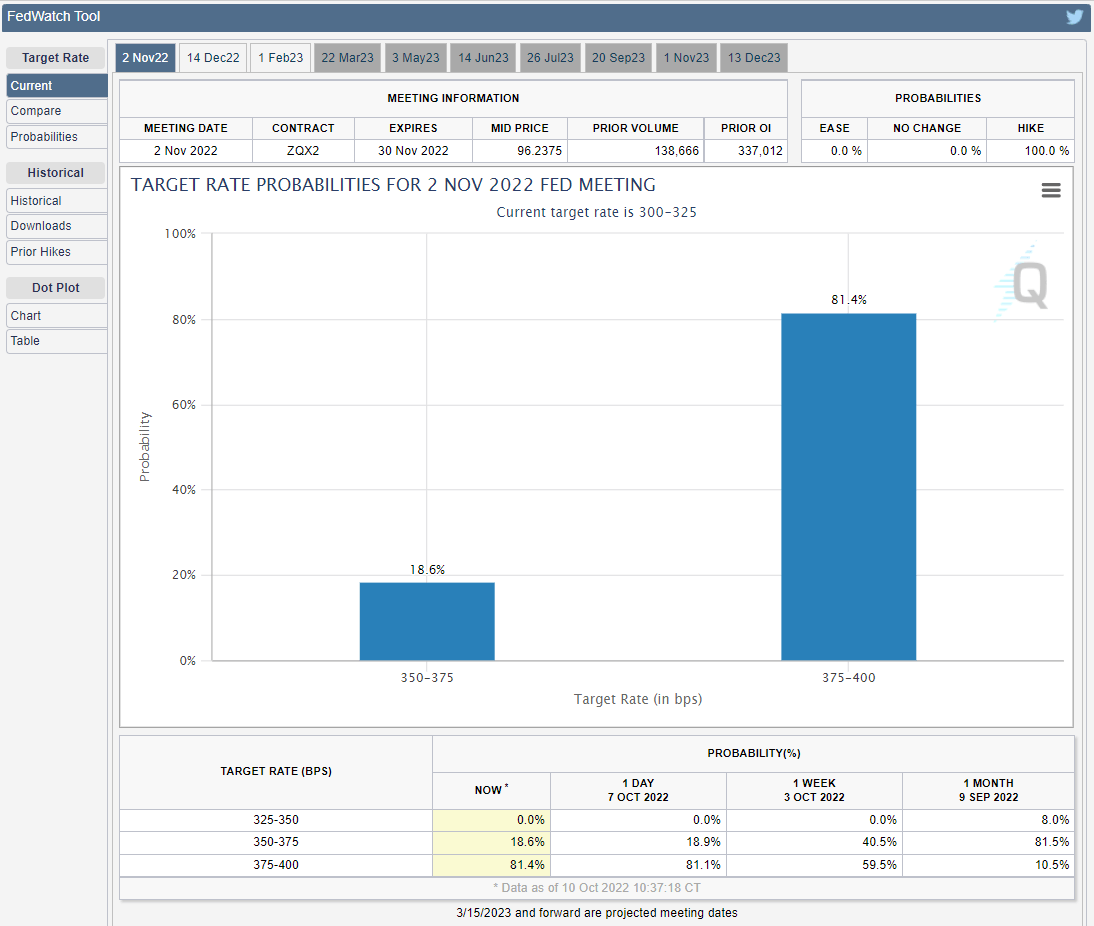
Source: CME Group
With tight U.S. labor markets and inflation struggling to come down materially, policymakers are likely to forge ahead with their plans to raise borrowing costs to a sufficiently restrictive level in the coming months. Recent Fedspeak also suggests that rates will stay high-for-longer, ruling out a premature pivot in 2023.
The specter of an aggressive hiking cycle should put upward pressure on real yields, keeping the U.S. dollar, already trading near multi-decade highs, tilted toward further appreciation. In this environment, precious metals will underperform, increasing the likelihood of additional losses for both gold and silver.
Looking ahead, traders should pay close attention to the September U.S. inflation report due out for release on Thursday. Headline CPI is forecast to have risen 0.2% m-o-m and 8.1% y-o-y. The core gauge, for its part, is seen clocking in at 0.4% m-o-m, with the annual rate projected to accelerate to 6.5% from 6.3%, matching the cycle’s high in March.
Any CPI upside surprise should be negative for gold prices insofar as it should lead to hawkish repricing of the Fed’s hiking path. While the yellow metal is typically viewed as a good inflation hedge, that theory only plays out over very long temporal intervals. Over short time horizons, yields and dollar movements should be more important for precious metals as displayed in the chart below.
Gold Prices (inverted scale), DXY Index and US 10-Year Real Yields Chart
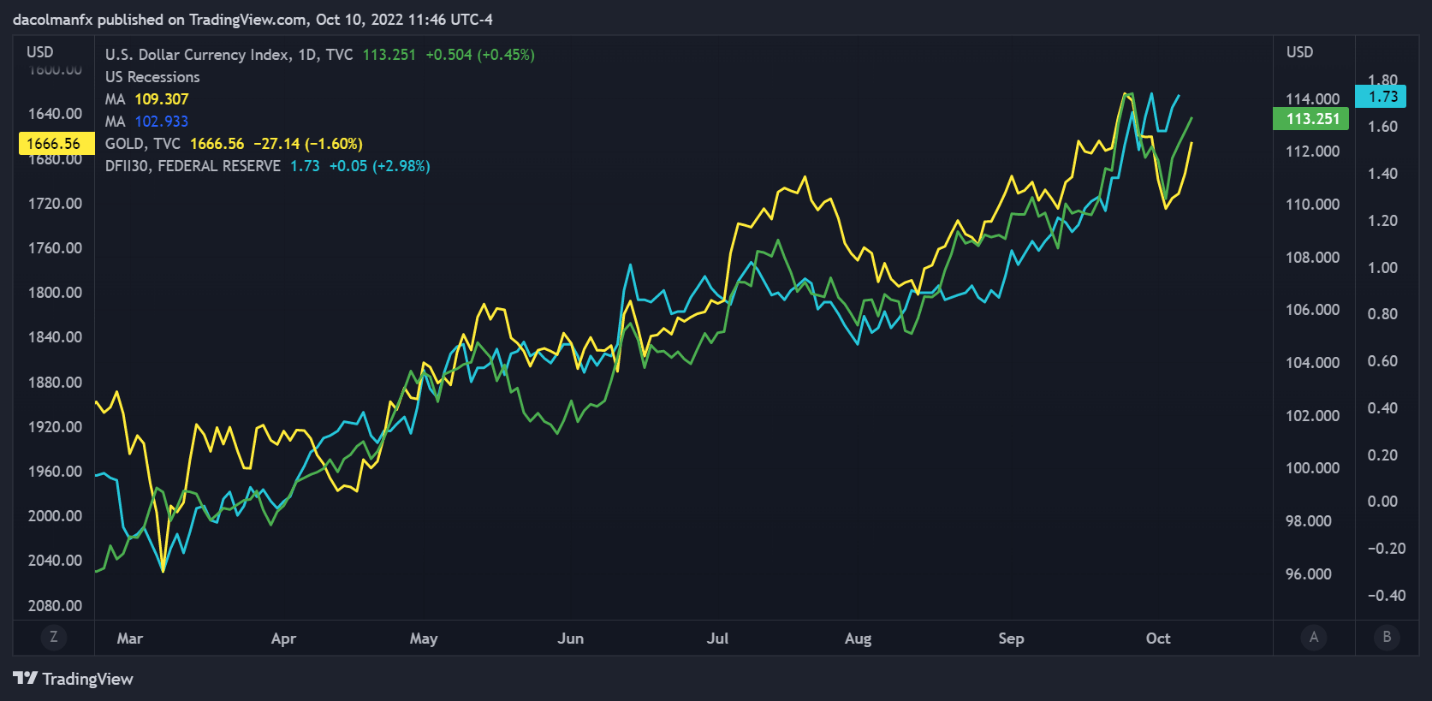
Source: TradingView
GOLD PRICES TECHNICAL ANALYSIS
Gold prices have steadily declined over the past four sessions after failing to clear trendline resistance near $1,740/$1,745, a sign that sellers are firmly entrenched in the driver’s seat now. Looking at the daily chart below, it can be seen that XAU/USD is sitting near a key support in the $1,680/$1,670 following the recent slump. If this floor is breached in the coming sessions, downside pressure could accelerate, paving the way for bears to challenge the 2022 lows at $1,622. On the flip side, if prices are rejected from current levels and pivot higher, initial resistance appears around the psychological $1,700 mark. On further strength, the focus shifts to $1,720 (dynamic trendline resistance).
GOLD PRICES TECHNICAL CHART
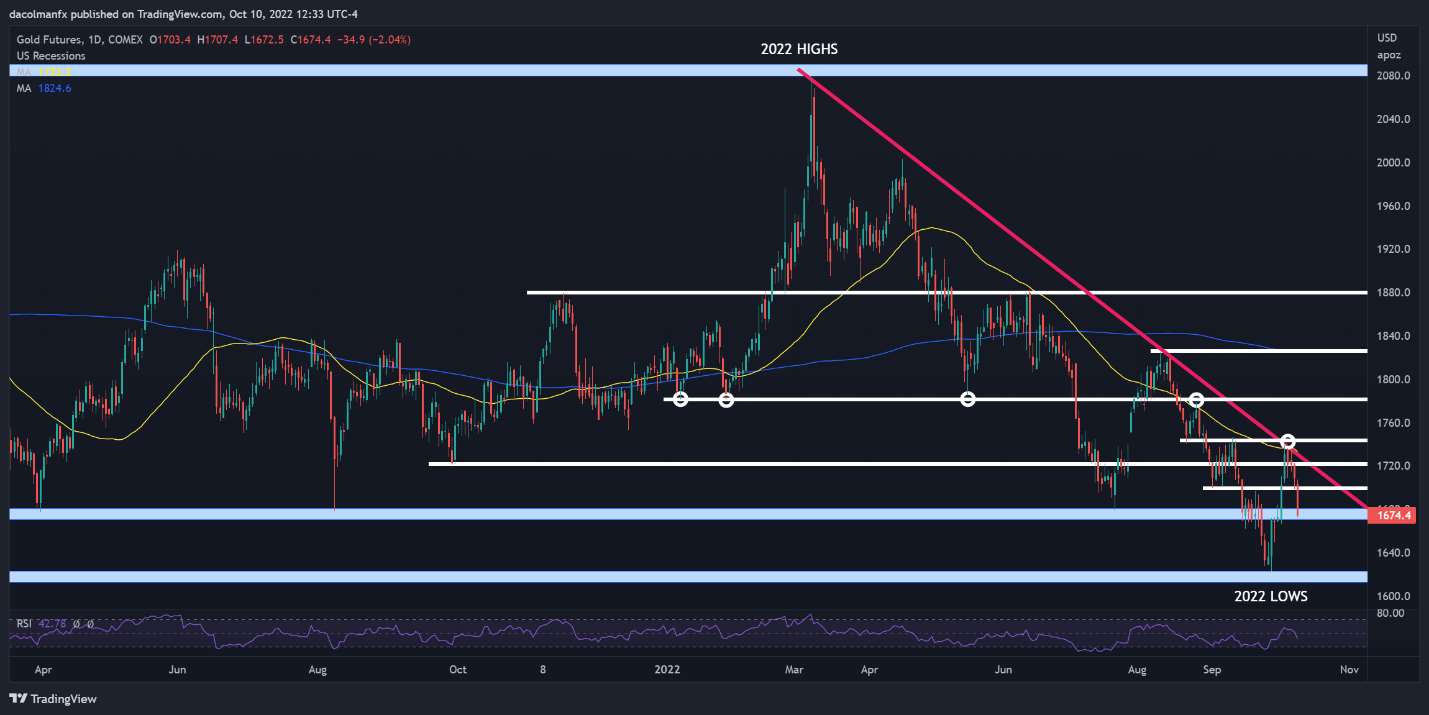
Gold Prices Chart Prepared Using TradingView
EDUCATION TOOLS FOR TRADERS
- Are you just getting started? Download the beginners’ guide for FX traders
- Would you like to know more about your trading personality? Take the DailyFX quiz and find out
- IG's client positioning data provides valuable information on market sentiment. Get your free guide on how to use this powerful trading indicator here.
---Written by Diego Colman, Market Strategist for DailyFX


