


Gold Price (XAU/USD), Chart, and Analysis
- FOMC minutes may underpin the Fed’s hawkish stance.
- Gold is likely to remain rangebound going forward.

US dollar volatility is likely to increase over the next 24-36 hours with a host of Fed speakers, economic releases, and the latest FOMC minutes all hitting the wires. The FOMC minutes are expected to confirm that the central bank remains committed to tightening monetary policy to curb inflation despite the recent lower-than-expected US cpi print fueling thoughts of a policy slowdown. The US market then closes on Thursday for the Thanksgiving Holiday, while the next day is an unofficial holiday, Black Friday. Both days will see sharply reduced levels of market activity.
For all market-moving data releases and events, see the DailyFX Economic Calendar.
Short-dated US Treasury yields have been moving higher recently with the one-year touching a multi-decade high of 4.85% (currently 4.79%) while the two-year recently hit a 15-year high yield of 4.88% (currently 4.50%). These yields will continue to support the US dollar, keeping pressure on the precious metal. US interest rates have been the driver for gold over the past months, and with the Fed still intent on tightening, any further upside for gold will be difficult until the central bank signals that interest rates are at, or close to, an appropriate level.

The price of gold is pushing higher today after four days of losses. We looked at how the precious metal was potentially building a bullish flag setup recently and while this may still be possible, any further losses will make this unlikely. In the short term the price of gold is likely to trade between $1,729/oz. and $1,787/oz. with support more likely to be tested.
Gold Price Consolidates, Is a Bullish Flag Being Formed?
Gold Daily Price Chart – November 22, 2022
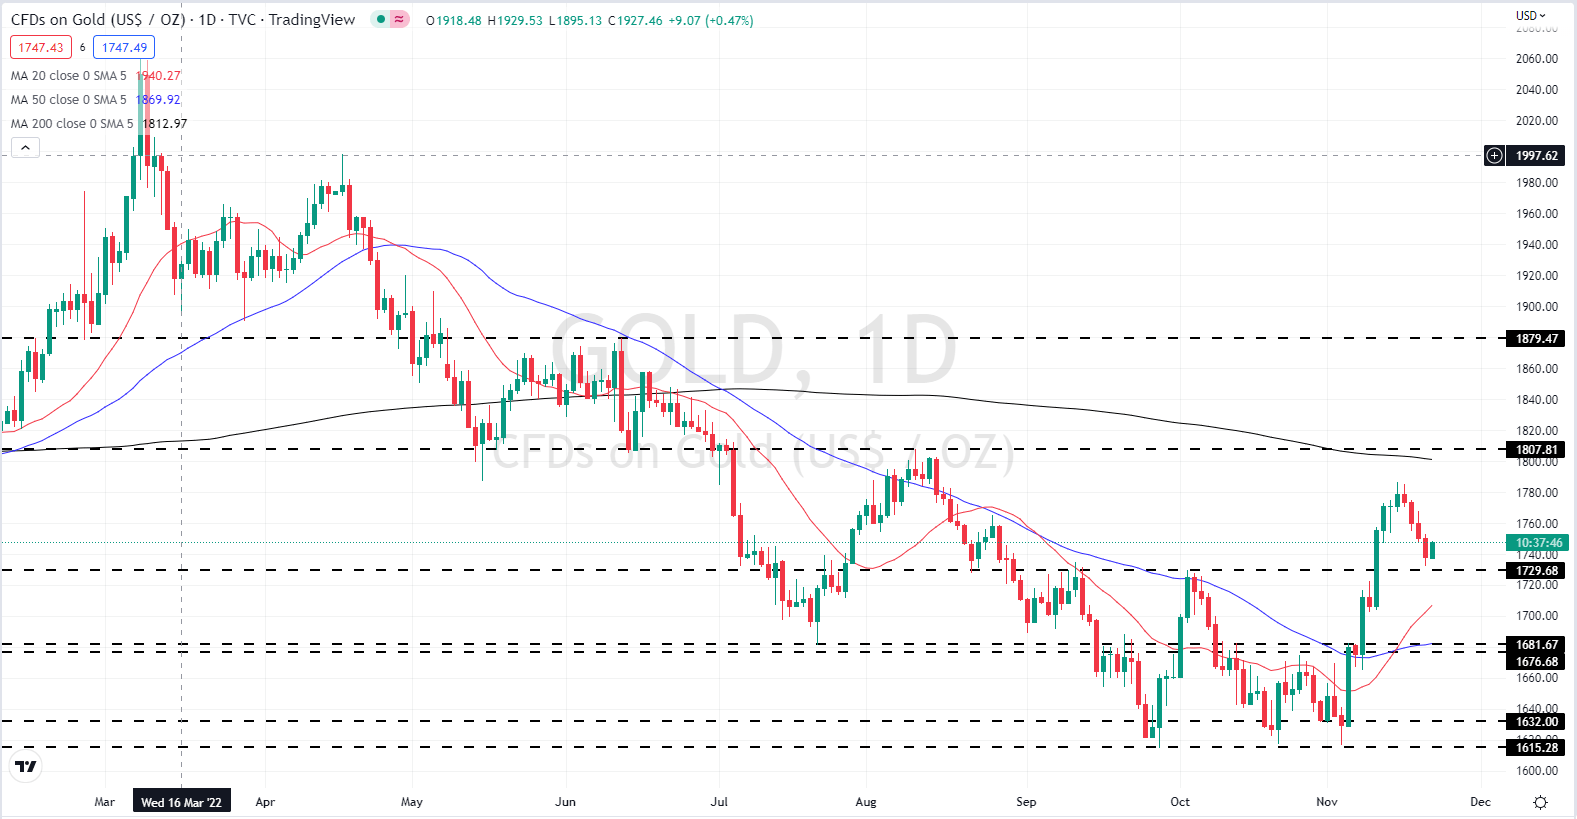
Chart via TradingView
| Change in | Longs | Shorts | OI |
| Daily | 3% | -5% | -1% |
| Weekly | 12% | 3% | 7% |
Retail Traders Continue to Build Net-Shorts
Retail trader data show 63.09% of traders are net-long with the ratio of traders long to short at 1.71 to 1.The number of traders net-long is 3.80% higher than yesterday and 5.89% lower from last week, while the number of traders net-short is 14.92% higher than yesterday and 27.02% higher from last week.
We typically take a contrarian view to crowd sentiment, and the fact traders are net-long suggests Gold prices may continue to fall. Yet traders are less net-long than yesterday and compared with last week. Recent changes in sentiment warn that the current Gold price trend may soon reverse higher despite the fact traders remain net-long.
What is your view on Gold – bullish or bearish?? You can let us know via the form at the end of this piece or you can contact the author via Twitter @nickcawley1.


