


Gold (XAU/USD) Analysis
- Gold on the back foot as markets price in higher future interest rates
- Technical considerations: 1833 seen as a tripwire for continued selling
- The analysis in this article makes use of chart patterns and key support and resistance levels. For more information visit our comprehensive education library

Gold on the Back Foot as Markets Price in Higher Future Interest Rates
Gold continues to lose favor and appears to be an unattractive proposition as interest rate expectations shift higher. At the start of the month, bond markets anticipated a terminal Fed funds rate of around 4.8%. The rate has risen and now hovers around 5.3%, nearly 50 basis points higher. Such was the response to hotter than expected US labor (NFP) and economic data (ISM PMI services) which implied that the Federal Reserve Bank will be forced to hike rates even higher before holding steady at an elevated level. Higher interest rates make the non-interest bearing commodity like gold less appealing, particularly as disinflation sets in.
Gold: Technical Considerations
In early February the 4-hour chart helped reveal a bear flag – a typically bearish continuation pattern that appears to have largely played out. With this pattern it is not unusual for the continuation (bearish move) after the flag consolidation phase to track that of the original impulse. What we have witnessed is a much gentler decline compared to the sharp selloff that ensued earlier in the month.
However, recent price action appears to suggest a slowdown as prices consolidate around a rather key level of interest, 1833.
Gold (XAU/USD) 4-Hour Chart
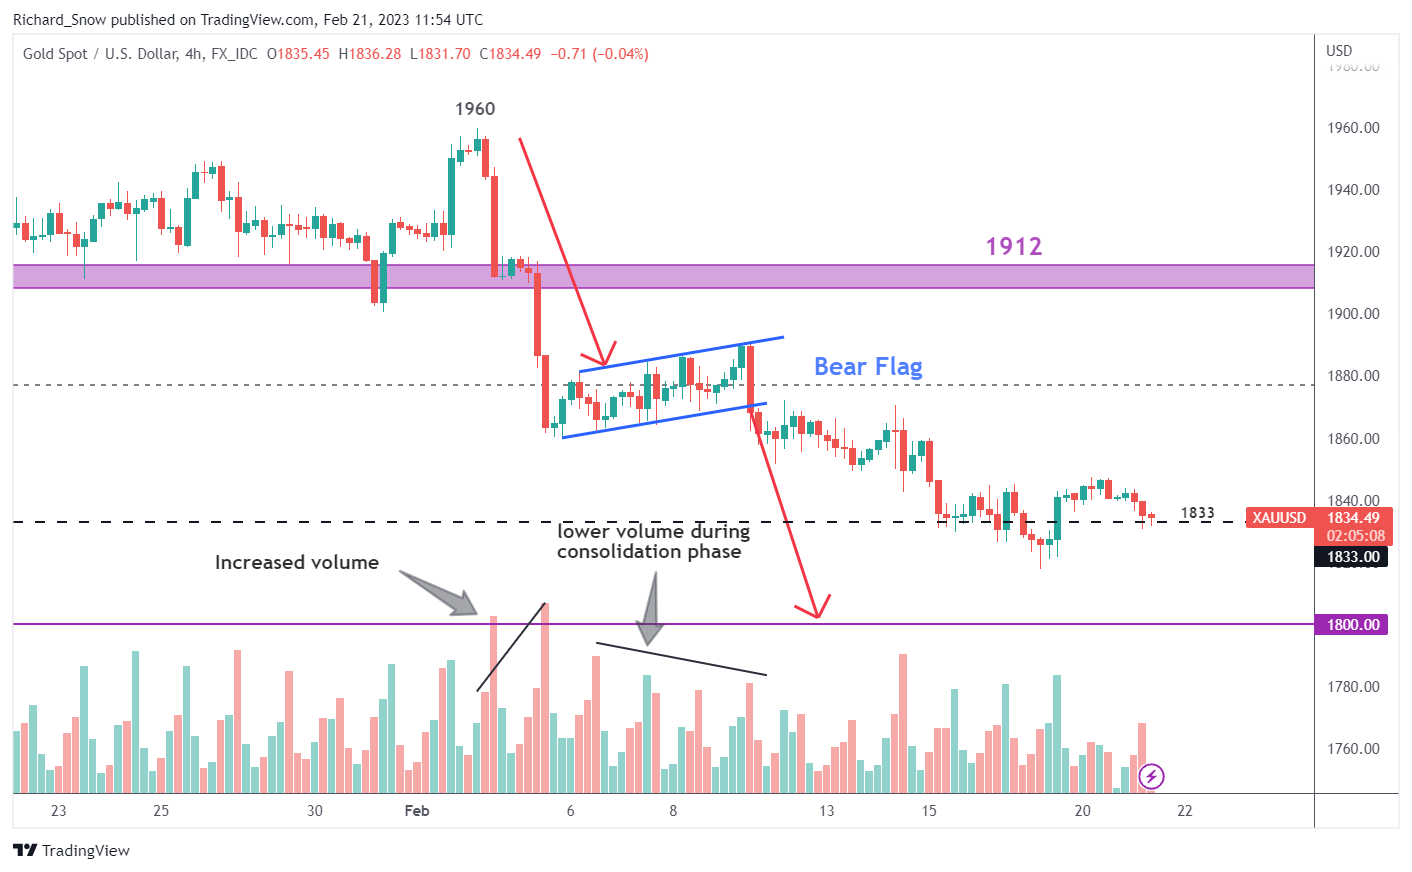
Source: TradingView, prepared by Richard Snow

1833 coincides with a prior spike high at the very end of last year and has, thus far, acted as a deterrent for lower prices. The gold price did actually trade below 1833 but failed to close below this crucial level on the daily chat. Therefore, this has become crucial to assessing the potential for a sustained move to the downside, towards the psychological level of 1800. Resistance appears at 1875 which coincides roughly with the level of the ‘flag’ or channel, which would necessitate a reevaluation of bearish momentum thereafter. Furthermore, 1875 provided a pivot point for advancing prices in both June 2022 and November 2021.
Gold (XAU/USD) Daily Chart
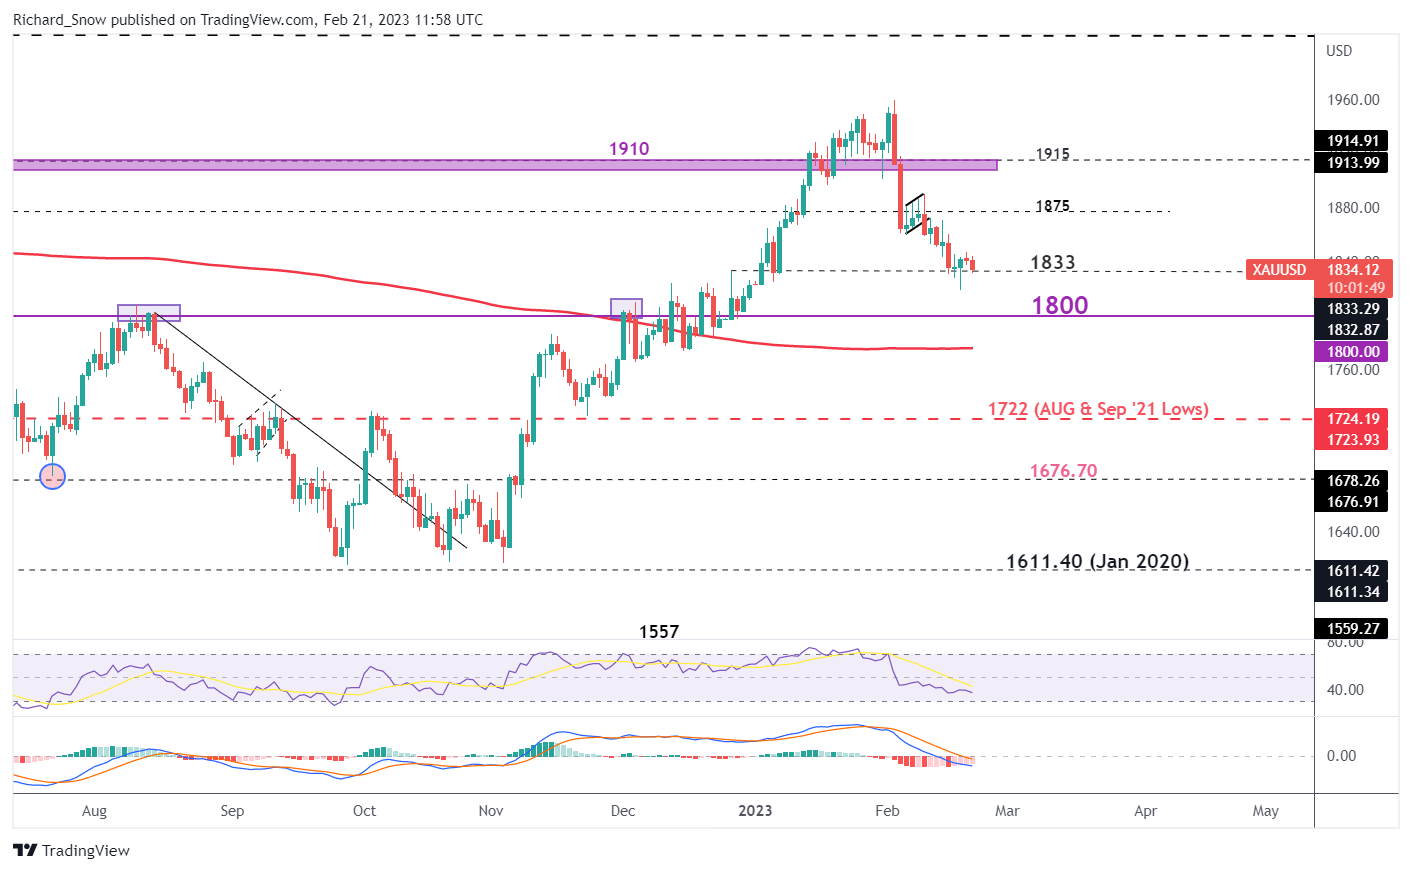
Source: TradingView, prepared by Richard Snow
--- Written by Richard Snow for DailyFX.com
Contact and follow Richard on Twitter: @RichardSnowFX


