
Gold price outlook: Bullish above $1,850
- Gold prices plunge to new lows, but bullish hammer provides a glimmer of hope for bulls.
- GC heads back to $1,850 resistance, opening the door for a stronger correction that could help lift prices in the short-term. Fed rate expectations continue to threaten Gold’s imminent recovery.
- CCI (commodity channel index) falls into oversold territory – will gold fight the Fed and retaliate against the Dollar?

Fear of the Fed Drives XAU/USD into Oversold Territory – Bullish Hammer Provides Temporary Hope for Buyers
Gold prices fell for a third consecutive week after Fed officials triggered fears of further rate hikes. With the precious metal extending declines, a break of the bear flag and a move below the 50-day MA (moving average) has supported the bearish move.
As the February sell-off pushed GC futures briefly below the January 2023 low, gold has made a new yearly low, currently holding as support at $1,827.7.
Gold Price (GC1!) Chart
Gold Futures Daily Chart
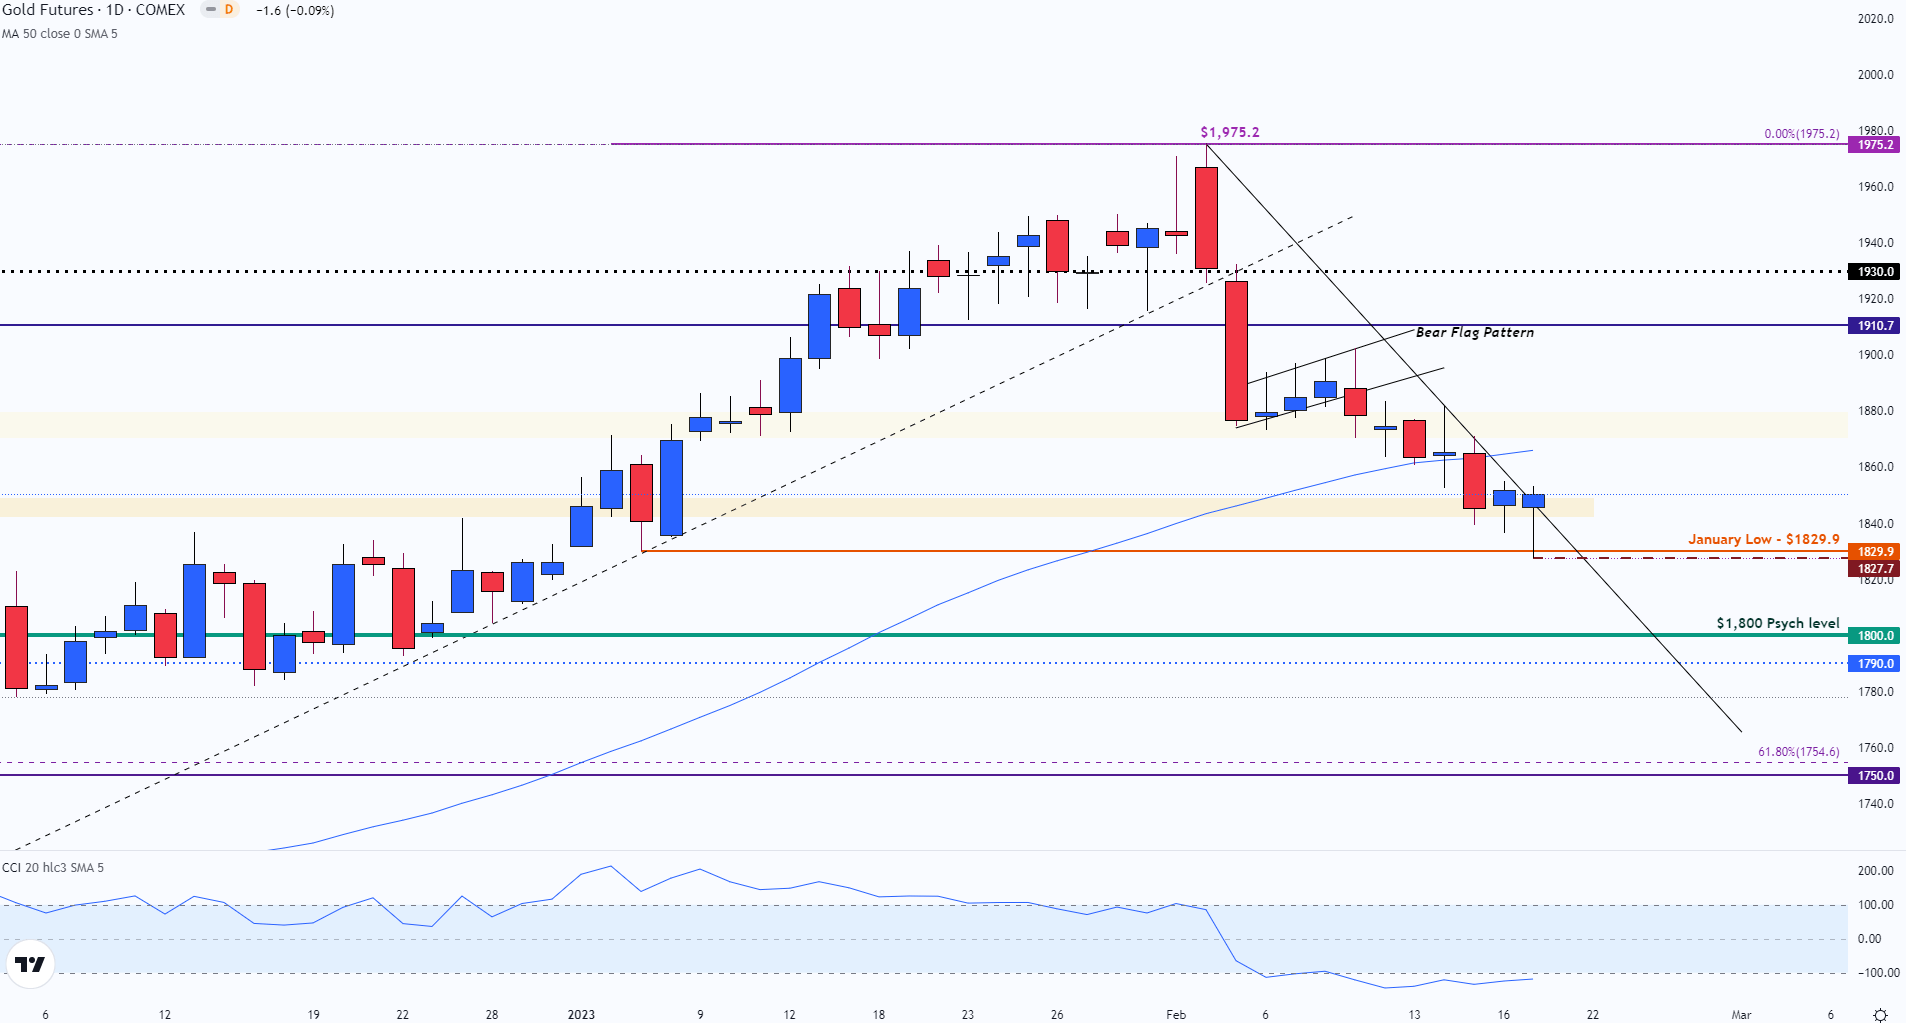
Chart prepared by Tammy Da Costa using TradingView

After reaching a high of $1,957.2 earlier this month, the shift in the fundamental narrative exacerbated gold’s sell-off, leaving the safe-haven metal vulnerable to additional losses. However, as market participants priced in the renewed possibility for a 50 basis-point rate hike at the March FOMC, a bounce off support helped cap further losses.
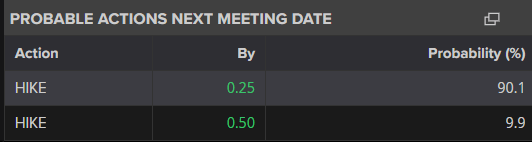
Source: Refinitiv
Although XAU/USD has currently erased approximately 4.89% of January’s gains (of 6.52%), the sharp three-week sell-off has pushed the daily CCI (commodity channel index) into negative territory.
This suggests that the commodity may be oversold, opening the door for a rebound. However, with the body of the bullish hammer on the daily chart currently testing trendline resistance around $1,850, a clear break of this zone is necessary to drive prices higher.
Gold (XAU/USD) Price Levels
| Support | Resistance |
|---|---|
| $1,827.7 (Current monthly low) | $1,850 (Psychological resistance) |
| $1,800 (Psychological support) | $1,866 (50-day MA) |
| $1,754.6 (61.8% Fibonacci retracement of the Nov ‘22 – Feb ’23 move) | $1,900 (Psychological Resistance |
--- Written by Tammy Da Costa, Analyst for DailyFX.com
Contact and follow Tammy on Twitter: @Tams707