

The Pound May Probe Higher. Overall, the Bias Remains Bearish.
It’s been a mixed bag for the three Sterling pairs from a technical perspective. GBP/JPY saw British Pound strength while GBP/USD and EUR/GBP saw losses for Sterling in Q3. GBP remains bearish and given the BoJ intervention we could see GBP/JPY follow suit. Caution is advised as any moves will be heavily influenced by the hiking cycles of the various central banks as we approach the end of the year.
GBP/USD Weekly Chart
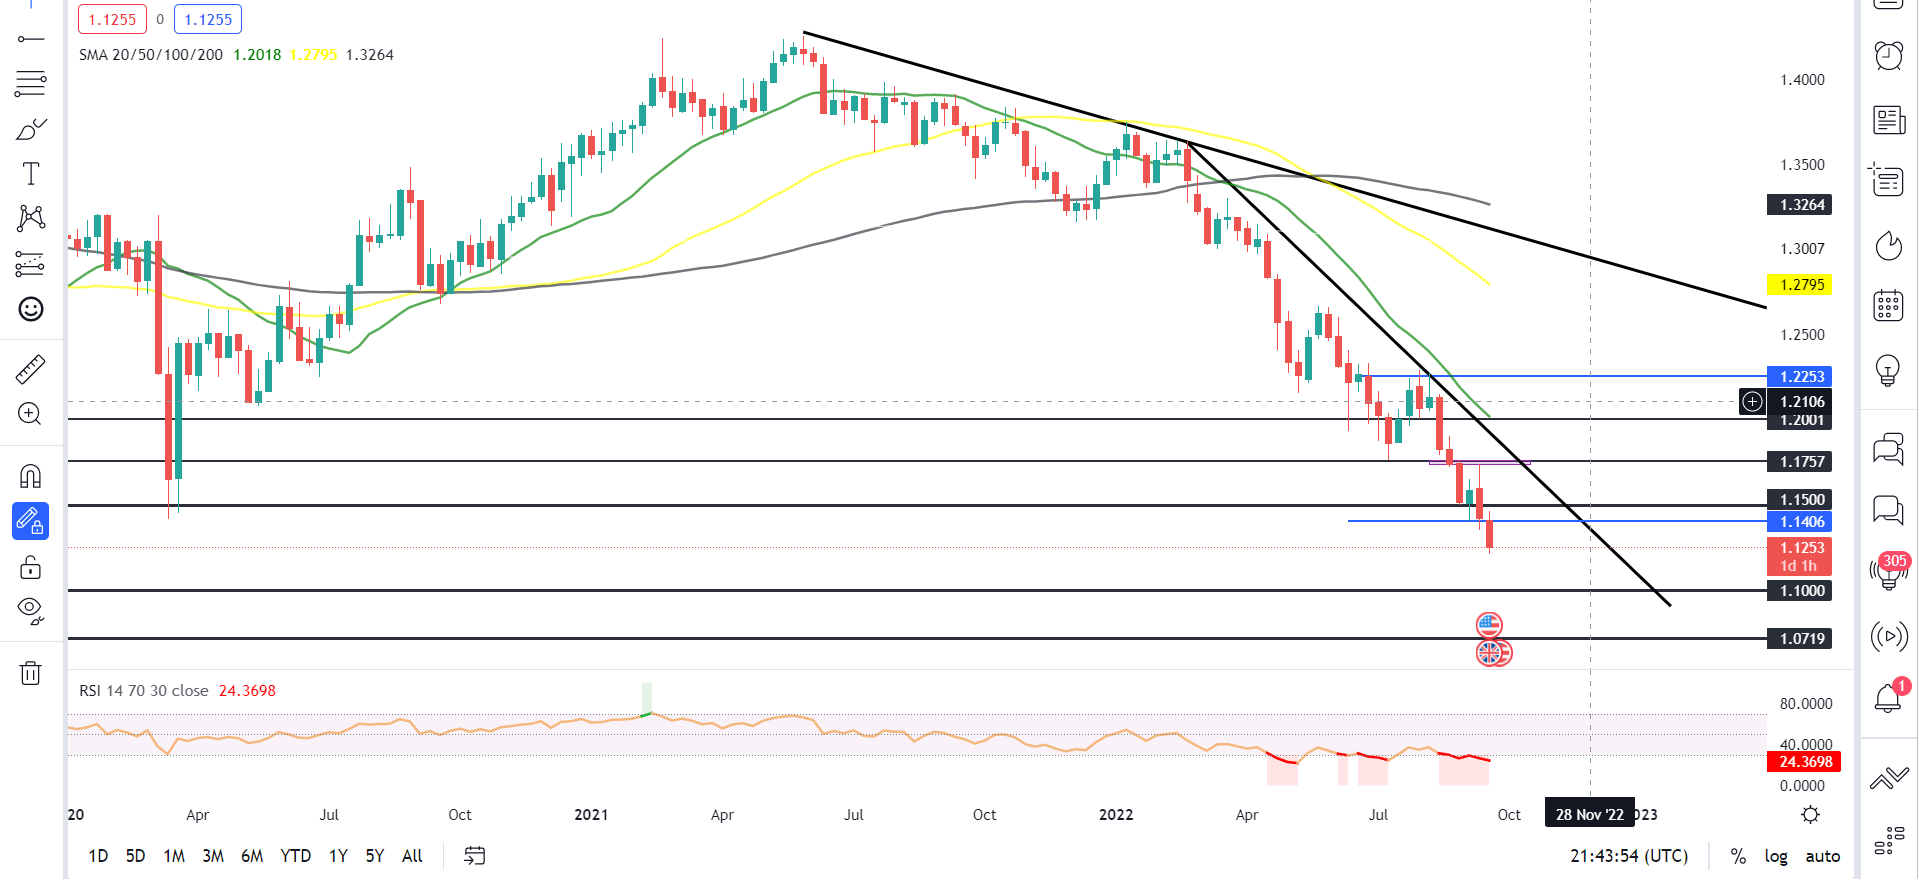
Chart prepared by Zain Vawda, TradingView
GBP/USD has continued its decline posting new lows throughout Q3 with the dollar index hitting multi-year highs in the process. We have seen multiple attempts to push higher with sellers remaining active in defending key resistance levels.
Since breaking the key 1.2000 level in mid-August we have seen a sharp decline with the 1.1750 support turned resistance level holding firm. Consensus has the British Pound posting further declines heading into Q4, however, given the steep decline and the fact that the RSI is already in oversold territory on the monthly, weekly, and daily timeframes we could be in for a retracement before continuing lower. The 20-SMA currently rests on the key psychological 1.2000 level, yet a retracement as deep as that might not be feasible with the current rate hiking cycles by both the Federal Reserve and the Bank of England. Resistance areas around the 1.1500 or 1.1750 might be more realistic for a pullback.
Key resistance levels: 1.1500, 1.1750, 1.2000, 1.2250
Key support levels: 1.1000, 1.0700, 1.0500
EUR/GBP, on the weekly chart below, provides an indication of price action at its best, as we have printed higher highs and higher lows since posting our YTD low in early March. We have just created a new high and found some resistance at the 0.88000 area with the RSI approaching overbought territory, and there is a chance for a pullback in the short-term. This could see us retest the moving averages resting below the current price creating a new higher low. At this stage the path of least resistance remains to the upside, so should we create a new higher low this may provide a good risk-to-reward for potential longs if they want to get involved. A candle break and close below the most recent higher low at 0.83800 would invalidate the bullish setup and see us decline further. Alternatively, a break and close above 0.88000 would see us push higher into resistance areas around 0.89250-0.90000.
Key resistance levels: 0.88000, 0.89250, 0.90000, 0.92000
Key support levels: 0.86325, 0.85500, 0.83800, 0.82000
EUR/GBP Weekly Chart
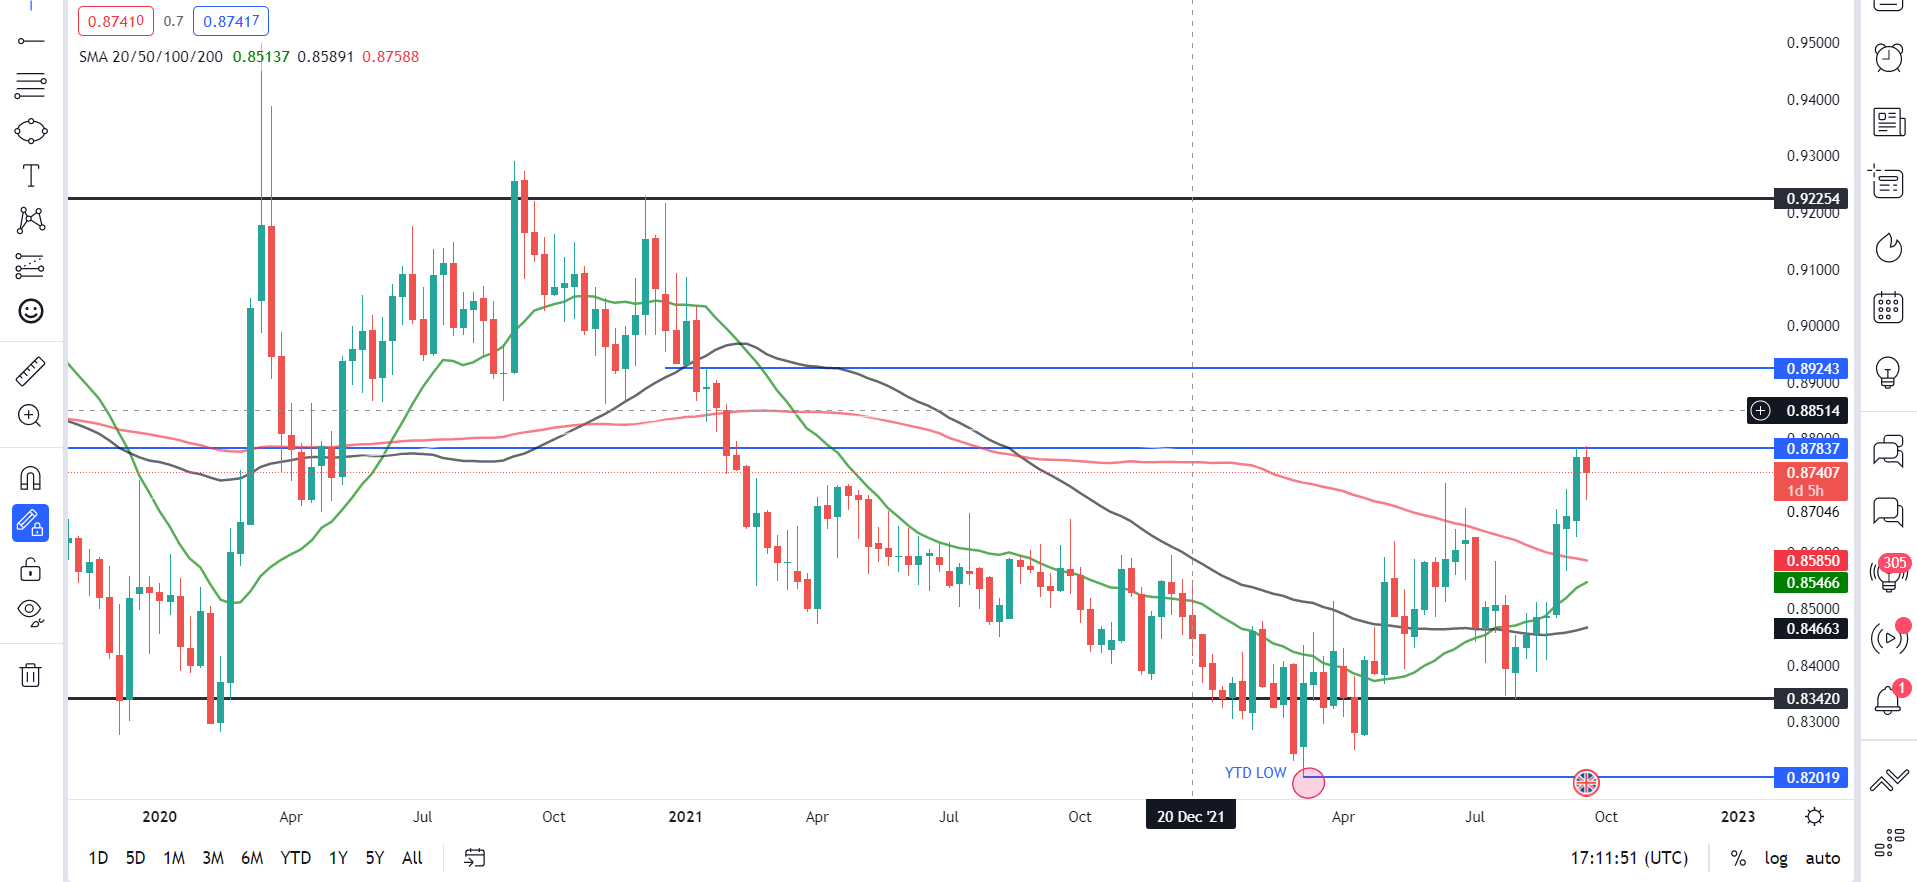
Chart prepared by Zain Vawda, TradingView
GBP/JPY Weekly Chart
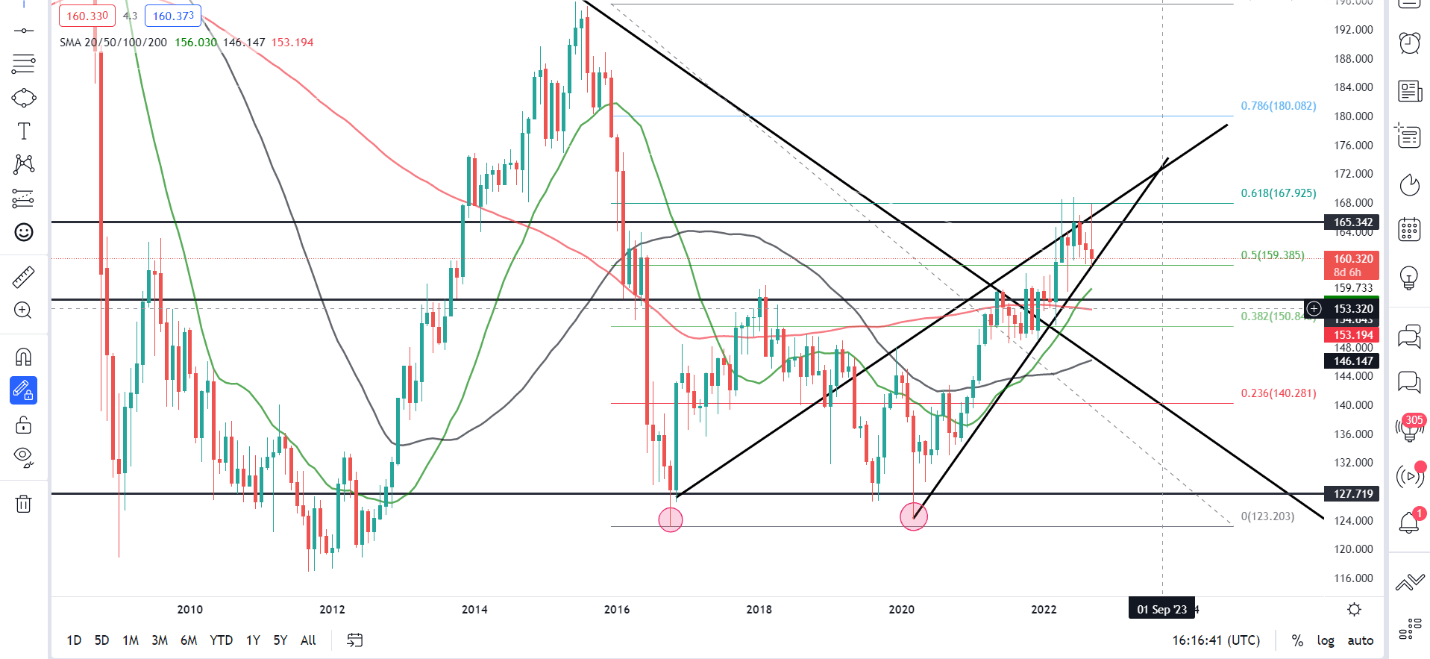
Chart prepared by Zain Vawda, TradingView
GBPJPY as you can see from the monthly chart has effectively double bottomed in March 2020 just prior to the pandemic low at (123.250) and since then has been on a steady move higher. We have spiked and rejected the 61.8% fib level 3 times, including the current month. The rising wedge chart pattern, which is now under threat, could lead to further downside should we see a monthly candle close below. We do have a host of technical hurdles providing support including the 20, 50, and 100- SMA which may result in a pullback before moving higher.
The big picture means a rally higher will need a weekly or monthly candle close above 166.00 to see the upside momentum continue. Alternatively, a break and candle close below 154.00 will see a change in price action and invalidate the most recent higher low.
Key resistance levels: 163.200, 166.000, 168.000
Key support levels: 156.300, 154.000, 150.850, 146.800
Trade Smarter - Sign up for the DailyFX Newsletter
Receive timely and compelling market commentary from the DailyFX team