


FTSE Technical Analysis
- Will the 8000 level prove too much for FTSE bulls?
- Signs of fatigue emerging despite the index printing higher highs
- The analysis in this article makes use of chart patterns and key support and resistance levels. For more information visit our comprehensive education library

Will 8000 Prove too Much for FTSE Bulls?
Trading in the direction of the trend is not only sensible, but often the most prudent approach when analyzing financial markets. That holds true until a period of consolidation hints at a potential trend reversal somewhere down the line.
Considering the healthy uptrend and overall outperformance of the FTSE 100 when compared to other major indices like the Nasdaq or S&P 500, it may be too early to call an end to such a strong performing market but early signs of fatigue are appearing.
The RSI reveals negative divergence, a potential ‘canary in the coal mine’ that may see a resistance to further price advances. Price action has clearly made higher highs while the RSI reveals a lower high. Given past performance, it remains unlikely the FTSE will turn sharply. Instead, the negative divergence prompts a greater consideration for further evidence of an overbought market in the trading sessions to come.
FTSE 100 Daily Chart
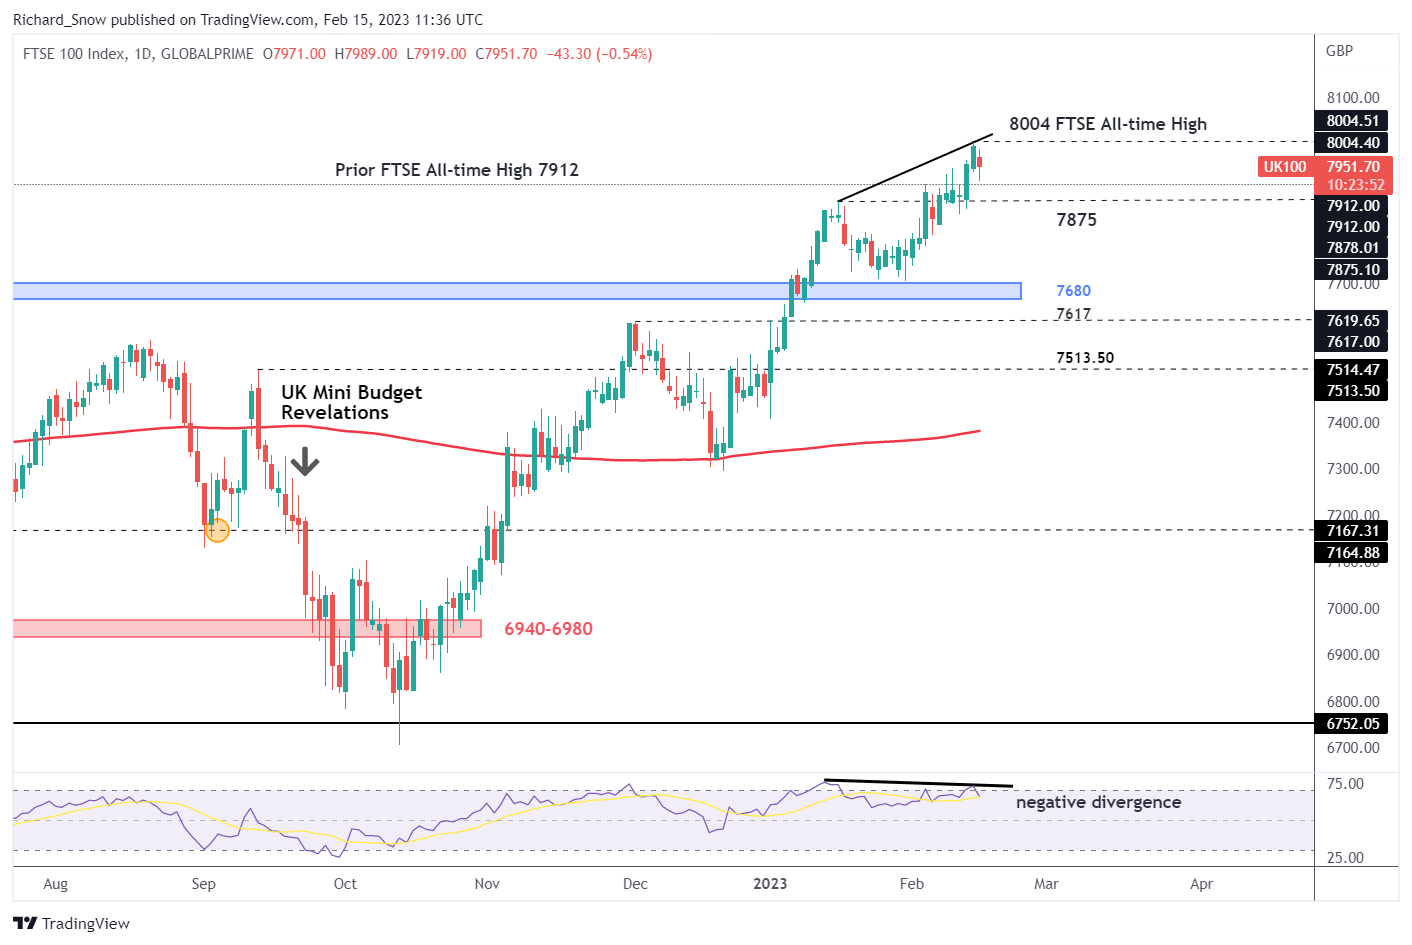
Source: TradingView, prepared by Richard Snow
The 4-hour chart provides an opportunity to assess shorter time price action for potential signs of a bearish retracement and the pitchfork allows a suitable framework to conduct such analysis.
Apart from a few breaches to the downside, the pitchfork contains the majority of price action, particularly recent price action. The midline of the pitchfork has acted as a pivot point on numerous occasions (yellow circles) which can be used as a guideline for ensuing price action with regard to a deeper bearish pullback or a bounce with a view to move higher. Look out for the candle close of the 4-hour chart on either a break below the midline or an advance higher, for an indication of intra-day movement.
FTSE 100 4-Hour Chart
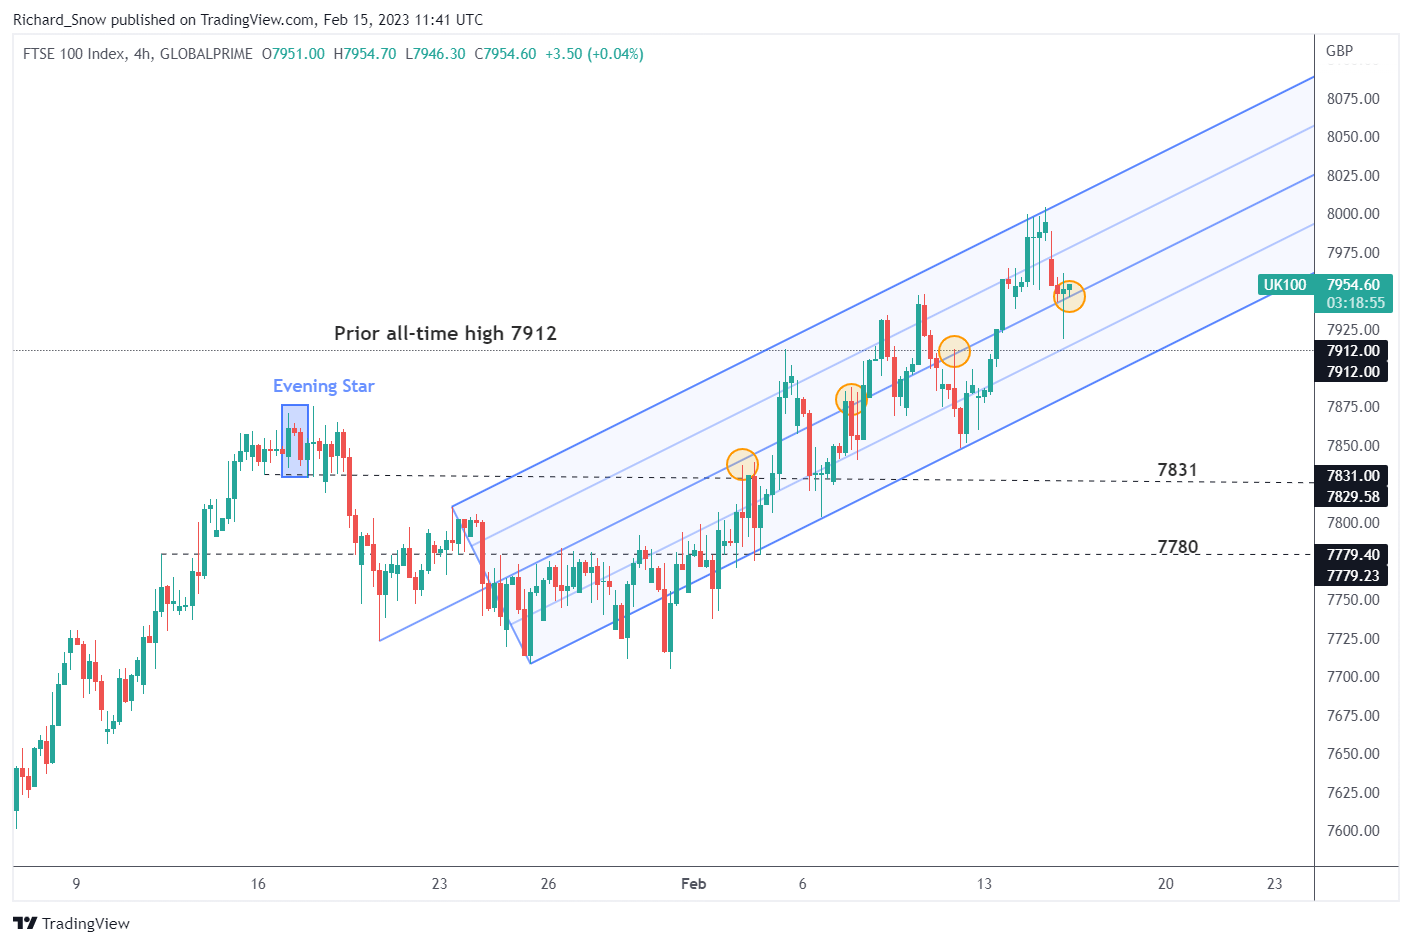
Source: TradingView, prepared by Richard Snow
Support lies at the prior high of 7912, followed by 7875 (daily chart). Resistance comes in at the psychological 8000 level – which has been tagged on CFD charts but appears to have been resisted on the underlying index.

--- Written by Richard Snow for DailyFX.com
Contact and follow Richard on Twitter: @RichardSnowFX


