FTSE 100, DAX 40, and S&P 500 Prices, Analysis, and Charts
Article written by IG Senior Market Analyst Axel Rudolph

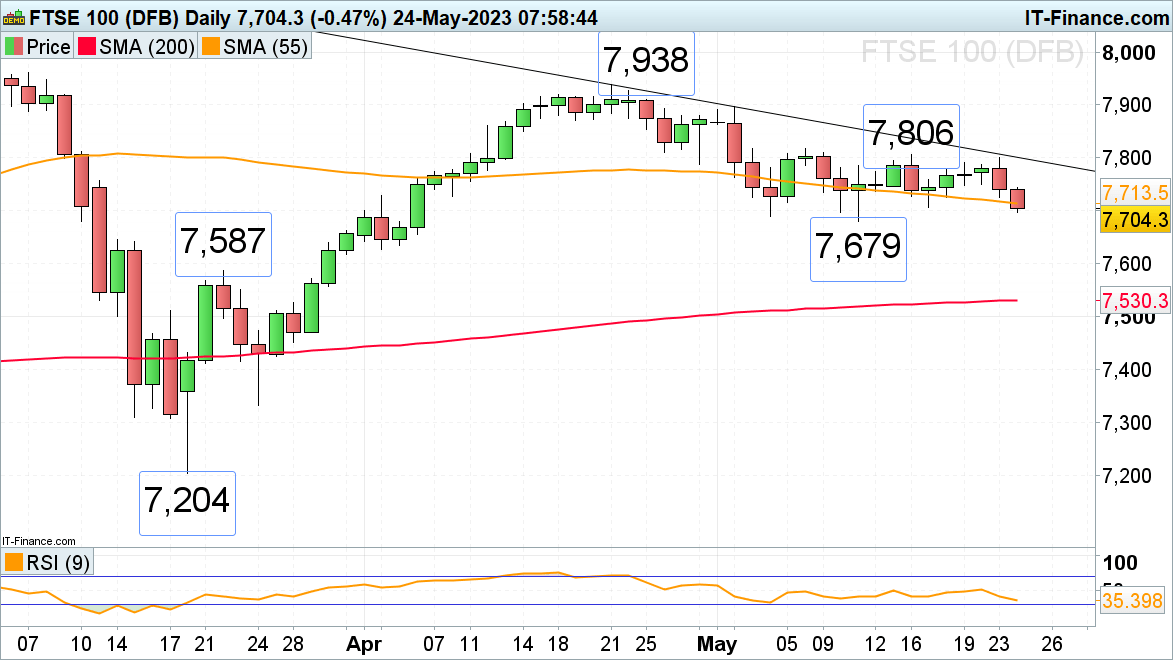
FTSE 100 drops on US debt ceiling woes and higher-than-expected UK CPI
The FTSE 100 is seen slipping back towards the early and mid-May lows at 7,689 to 7,679 amid ongoing US debt ceiling negotiations and higher-than-expected UK CPI. This area may offer support on Wednesday.
UK CPI fell less than expected to 8.7% year-on-year (versus an expected 8.2%) due to a sharp slowdown in energy prices. Despite it being the lowest reading since March 2022, it came in above expectations as food prices remain high. Core CPI rose to 6.8% YoY from 6.2% and monthly CPI by 1.2% versus a forecast 0.8%.
Were a daily chart close below 7,679 to be made, the early April low at 7,627 may be reached, below which lies the 22 March high at 7,587.
Minor resistance above the 55-day simple moving average (SMA) at 7,713 comes in at Monday’s 7,750 low.
FTSE 100 Daily Price Chart - May 24, 2023
Trade Smarter - Sign up for the DailyFX Newsletter
Receive timely and compelling market commentary from the DailyFX team
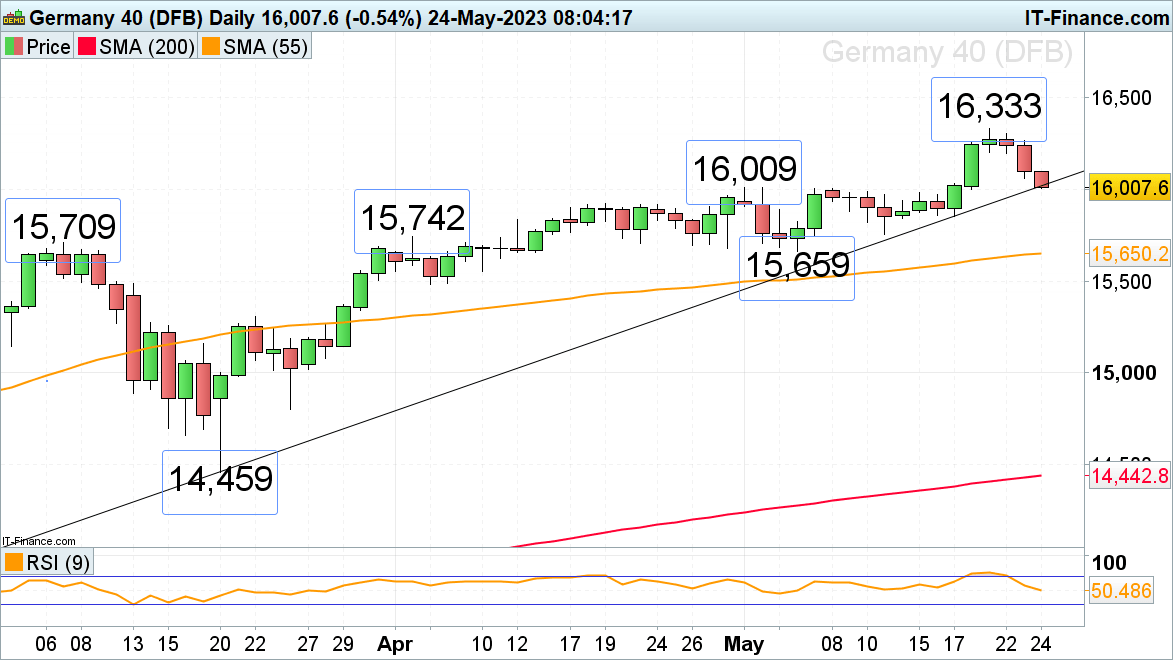
DAX 40 comes off its all-time record highs on US debt ceiling worries
The DAX 40 is swiftly coming off last week’s 16,333 all-time record high as ongoing US debt ceiling negotiations dampen investor mood.
The March-to-My uptrend line at 16,015 is being revisited, below which the early to mid-May highs at 16,009 to 16,005, together with the psychological 16,000 mark may offer support. Further down the mid-April-to-mid-May sideways trading zone around 15,900 may also offer support.
Minor resistance above Wednesday’s intraday high at 16,099 comes in around the 16,200 region.
DAX 40 Daily Price Chart - May 23, 2023

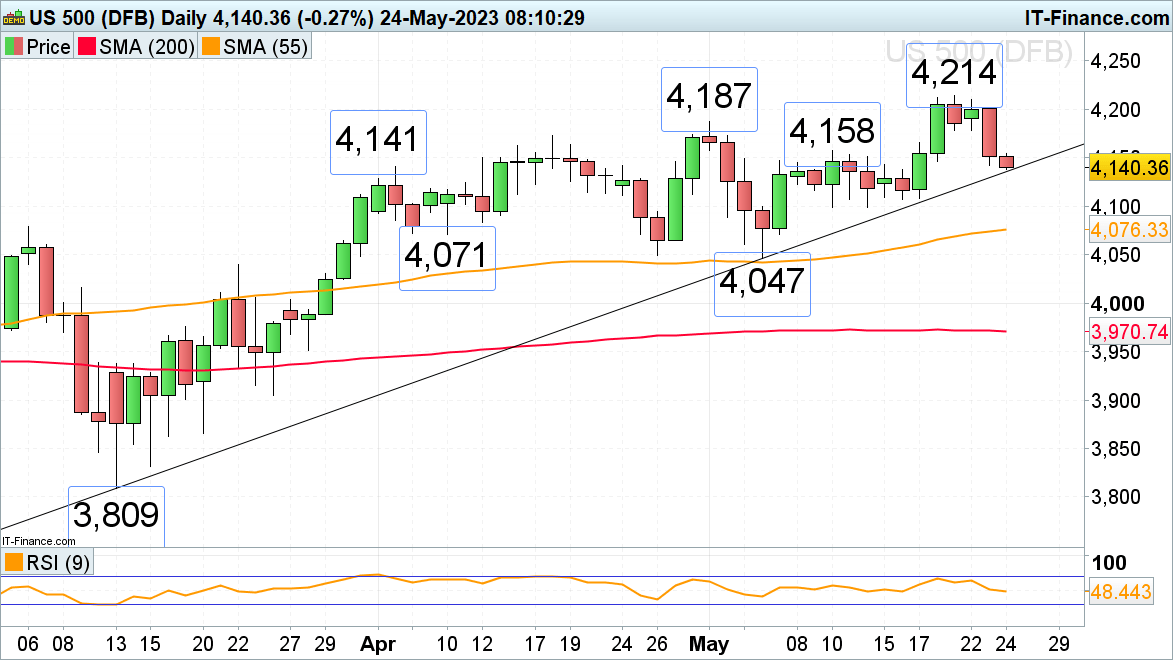
S&P 500 swiftly comes off its nine-month highs on stalled US debt negotiations
Last week the S&P 500 managed to rise above its 4,195 February peak to a nine-month high at 4,214 on hopes of a US debt ceiling rise being agreed. These have been thwarted on Tuesday when no agreement could be reached for now ahead of the 1 June deadline when the US would default.
Risk-off sentiment led to the March-to-May uptrend line at 4,136 being retested, a slip and daily chart close below which would engage the mid-May lows at 4,099. Further down the 55-day simple moving average (SMA) at 4,076 may offer additional support.
Minor resistance can now be found around the 10 May high at 4,158 and at the next higher 4,187 early May high.
S&P 500 DAily Price Chart - May 24, 2023