


GOLD OUTLOOK & ANALYSIS
- ISM services data boosts gold prices ahead of quiet week.
- Ascending triangle in focus.

XAU/USD FUNDAMENTAL FORECAST
Gold prices remain steady this Tuesday morning after yesterday’s rally on the back of the US ISM non-manufacturing PMI miss that reached fresh yearly lows – approaching contractionary territory. The US being a principally services funded economy meant the print brought significant downside for the US dollar and consequently upside for bullion.
The resultant impact on Fed funds futures (refer to table below) was a dovish repricing of interest rate expectations with a 75% probability of a rate pause next week.
Trade Smarter - Sign up for the DailyFX Newsletter
Receive timely and compelling market commentary from the DailyFX team
FEDERAL RESERVE INTEREST RATE PROBABILITIES
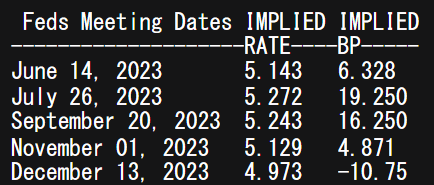
Source: Refinitiv
While economic data has been weighing on the greenback of recent, fund flows from the worlds largest physically backed gold ETF have been on the decline. Traditionally, gold prices move in tandem with this metric and with recent negative readings, gold upside has been capped.
SPDR GOLD TRUSDT ETF FUND FLOWS
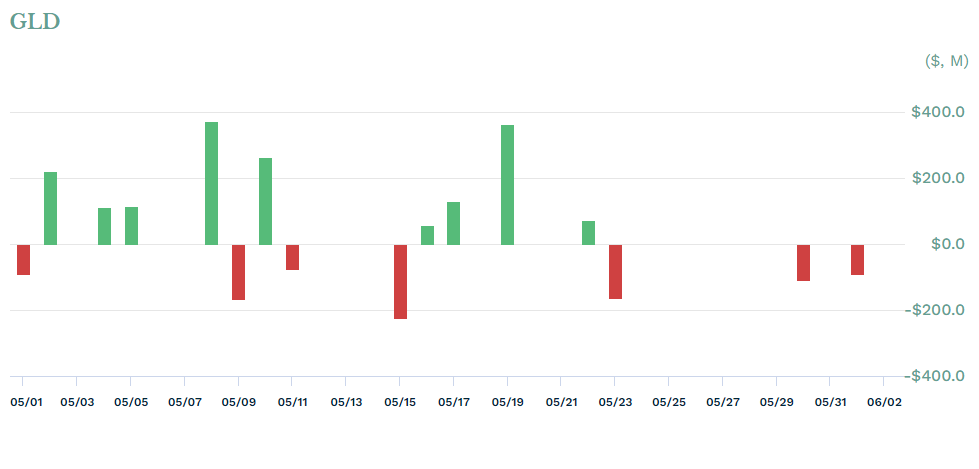
Source: etf.com
In addition, real yields (below) have plateaued around the 1.5% mark showing no real directional bias for gold to move with. Considering there is no further high impact US data for the week, I do not expect much in terms of gold price movement. The Volatility Index (VIX) has also been on the decline which is generally a net negative for the yellow metal.
US REAL YIELDS
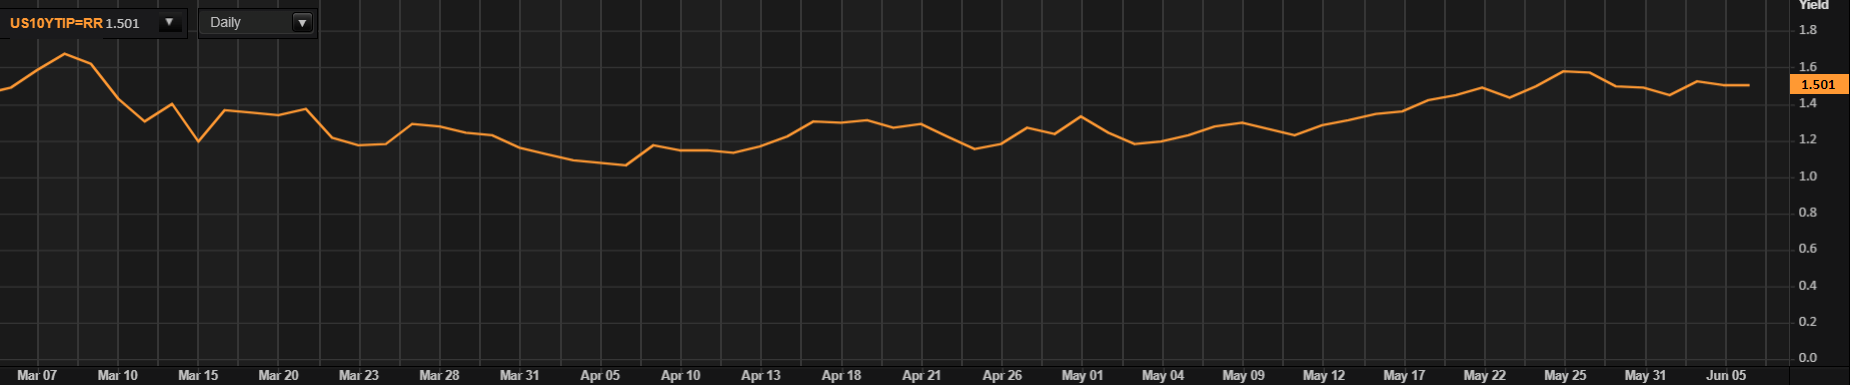
Source: Refinitiv
TECHNICAL ANALYSIS
Introduction to Technical Analysis
Candlestick Patterns
Recommended by Warren Venketas
GOLD PRICE DAILY CHART
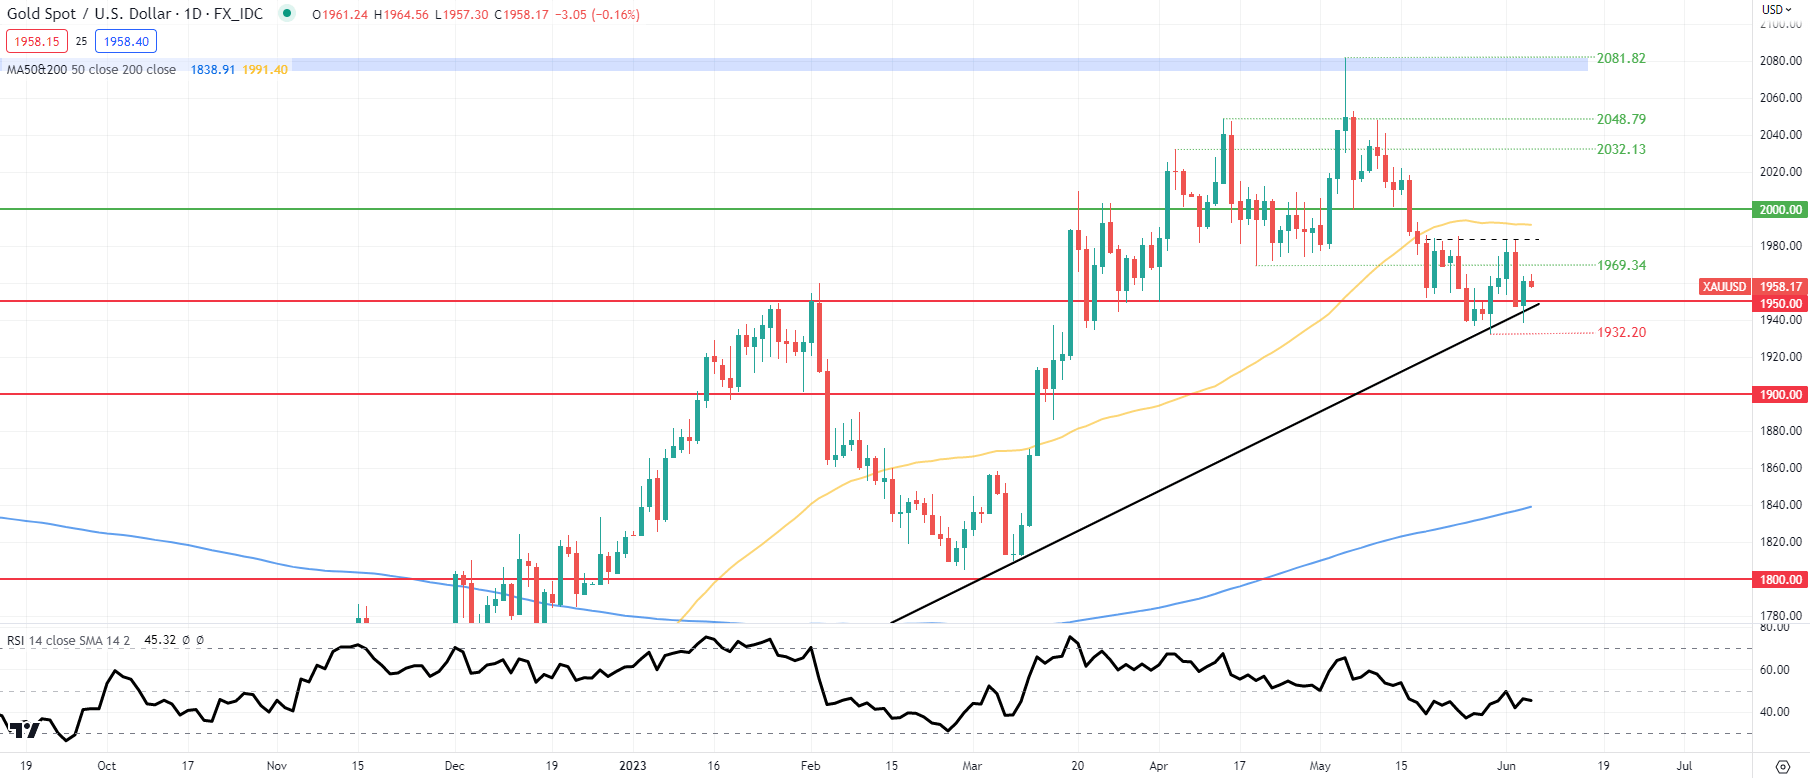
Chart prepared by Warren Venketas, IG
Daily XAU/USD price action has managed to hold its head above the 1950.00 psychological handle in respect of the long-term trendline support (black). On the resistance side, bulls seem unable to penetrate above the 1980.00 -1985.00 zone (dashed black line) which has now formed a short-term ascending triangle pattern. It may be a while before this zone can be tested once more – most likely via next week’s FOMC and CPI releases. The formation will be invalidated should bears push below the 1950.00/trendline support respectively, with a confirmation candle close.
Resistance levels:
- 50-day MA (yellow)
- Triangle resistance
- 1969.34
Support levels:
- 1950.00/Trendline support
- 1932.20
IG CLIENT SENTIMENT: BULLISH
IGCS shows retail traders are currently distinctly LONG on gold, with 68% of traders currently holding long positions (as of this writing). At DailyFX we typically take a contrarian view to crowd sentiment but due to recent changes in long and short positioning, we arrive at a short-term upside bias.
Contact and followWarrenon Twitter:@WVenketas


