


GOLD ANALYSIS & TALKING POINTS
- US CPI in focus this week for Fed pricing.
- Central banks continue to add to their coffers due to economic uncertainty.
- Technical factors suggest more downside to come for gold.

XAU/USD FUNDAMENTAL BACKDROP
Gold prices managed to stay buoyant this Monday after a significant drop towards the latter part of last week after US Non-Farm Payrolls (NFP) surprised to the upside. This week will now shift squarely onto the US CPI report to corroborate this jobs data and could result in further gold weakness.
Implied Fed funds futures pricing below suggests roughly 72bps of rate cuts by year end with the US banking crisis playing a role in stoking the cautionary fire. From a bullion perspective, market hesitancy should play into the safe haven allure of gold with central banks already showing signs of increasing their gold reserves. That being said, with the first rate cut forecasted for September, I believe this to be untimely and may weigh on gold as markets reprice to the hawkish-side depending on US economic data.
Trade Smarter - Sign up for the DailyFX Newsletter
Receive timely and compelling market commentary from the DailyFX team
FEDERAL RESERVE INTEREST RATE PROBABILITIES
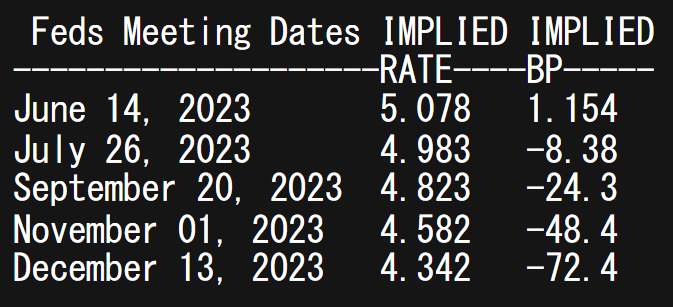
Source: Refinitiv
US real yields are pretty stagnant and reflect the anticipation around US inflation on Wednesday that should provide the fundamental catalyst need for short-term directional bias.
U.S. 10-YEAR TIPS – REAL INTEREST RATE
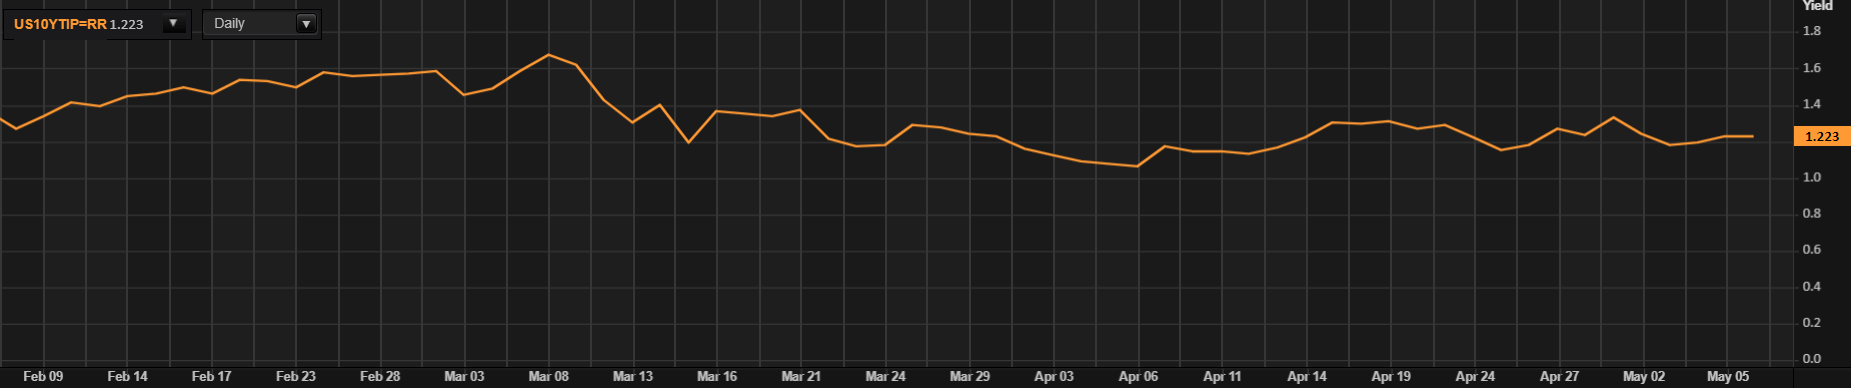
Source: Refinitiv
The economic calendar is relatively quiet today and should keep price volatility muted across financial markets.
ECONOMIC CALENDAR
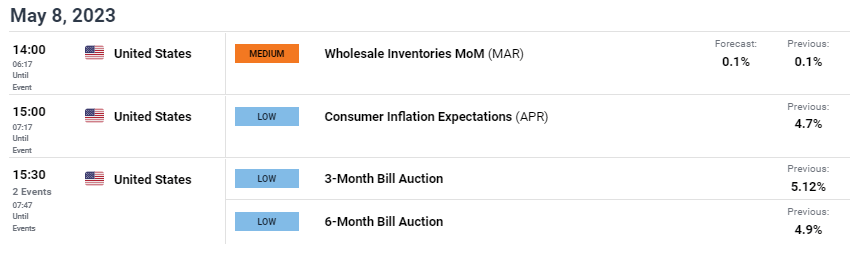
Source: DailyFX economic calendar
TECHNICAL ANALYSIS
Introduction to Technical Analysis
Candlestick Patterns
Recommended by Warren Venketas
XAU/USD DAILY CHART
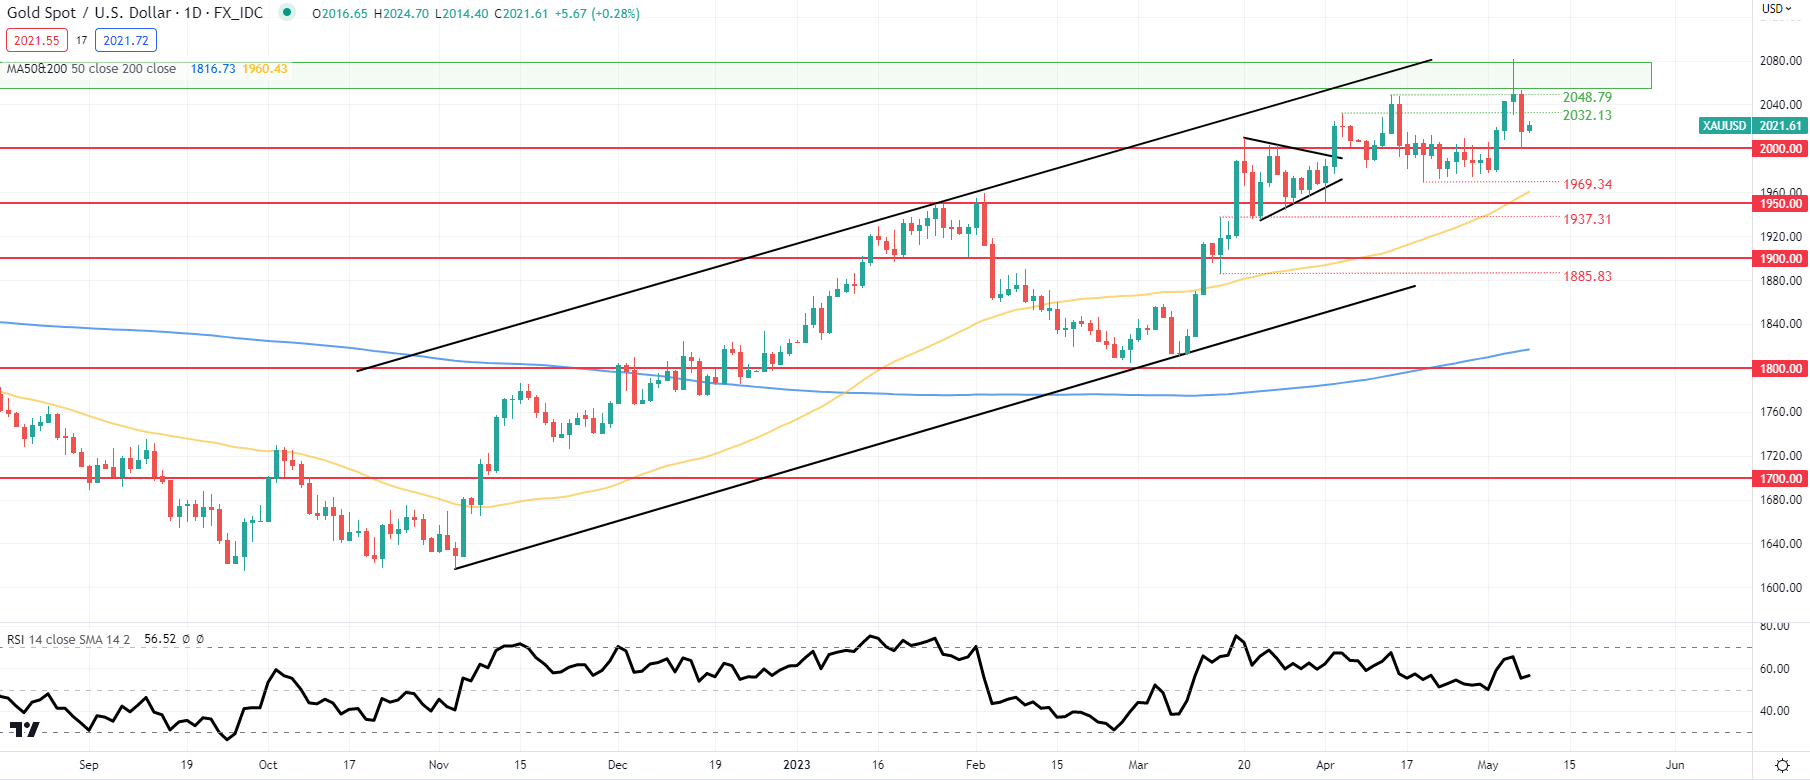
Chart prepared by Warren Venketas, IG
Daily XAU/USD price action contains two bearish components including a long upper wick on Thursday’s candle (last week) as well as bearish/negative divergence between gold prices and the Relative Strength Index (RSI). While weaker gold prices are underway, there could me more in store that may be supported by a break below the psychological $2000 handle. Mean reversion towards the 200-day MA (blue) is also on the cards as the differential between price and the MA is leaning towards extreme levels.
Resistance levels:
- 2050.00 – 2080.00
- 2048.79
- 2032.13
Support levels:
- 2000.00
- 1969.34
- 50-day MA (yellow)
- 1950.00
IG CLIENT SENTIMENT: BULLISH
IGCS shows retail traders are currently distinctly LONG on gold, with 55% of traders currently holding long positions (as of this writing). At DailyFX we typically take a contrarian view to crowd sentiment; however, due to recent changes in long and short position we arrive at a short-term upside disposition.
Contact and followWarrenon Twitter:@WVenketas


