


U.S. DOLLAR ANALYSIS & TALKING POINTS
- Fed speakers add to hawkish rhetoric.
- Will there be more follow through from the bull flag?

USD FUNDAMENTAL BACKDROP
The Dollar Index (DXY) has been rallying on the back of Fed officials lately which is slightly surprising as markets seemed unphased post-Non-Farm Payroll (NFP), CPI and retail sales data. In addition, Fed guidance has also been largely dismissed of recent but as the push for maintaining a tight monetary policy environment in the US grows, so does its influence on market participants. Revisions to the Fed cycle has been quite significant and already markets have upped their predictions to 5.3% (peak rate) for 2023 – see table below.
FEDERAL RESERVE INTEREST RATE PROBABILITIES
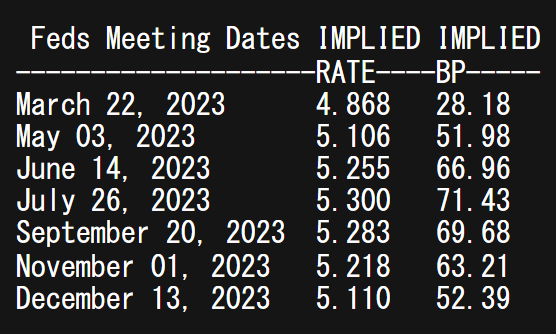
Source: Refinitiv
Trade Smarter - Sign up for the DailyFX Newsletter
Receive timely and compelling market commentary from the DailyFX team
Today, the Fed’s Mester mentioned “ January's CPI data showed that there's still more to do on cooling inflation” again compounding the messages sent out by yesterday’s speakers giving the dollar further support. One more Fed speaker is scheduled for today (Barkin) but the greenback is likely to close in the green going into next week.
ECONOMIC CALENDAR
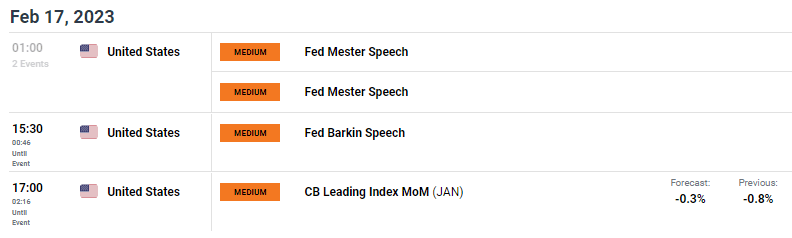
Source: DailyFX economic calendar
TECHNICAL ANALYSIS
Introduction to Technical Analysis
Candlestick Patterns
Recommended by Warren Venketas
U.S. DOLLAR INDEX DAILY CHART
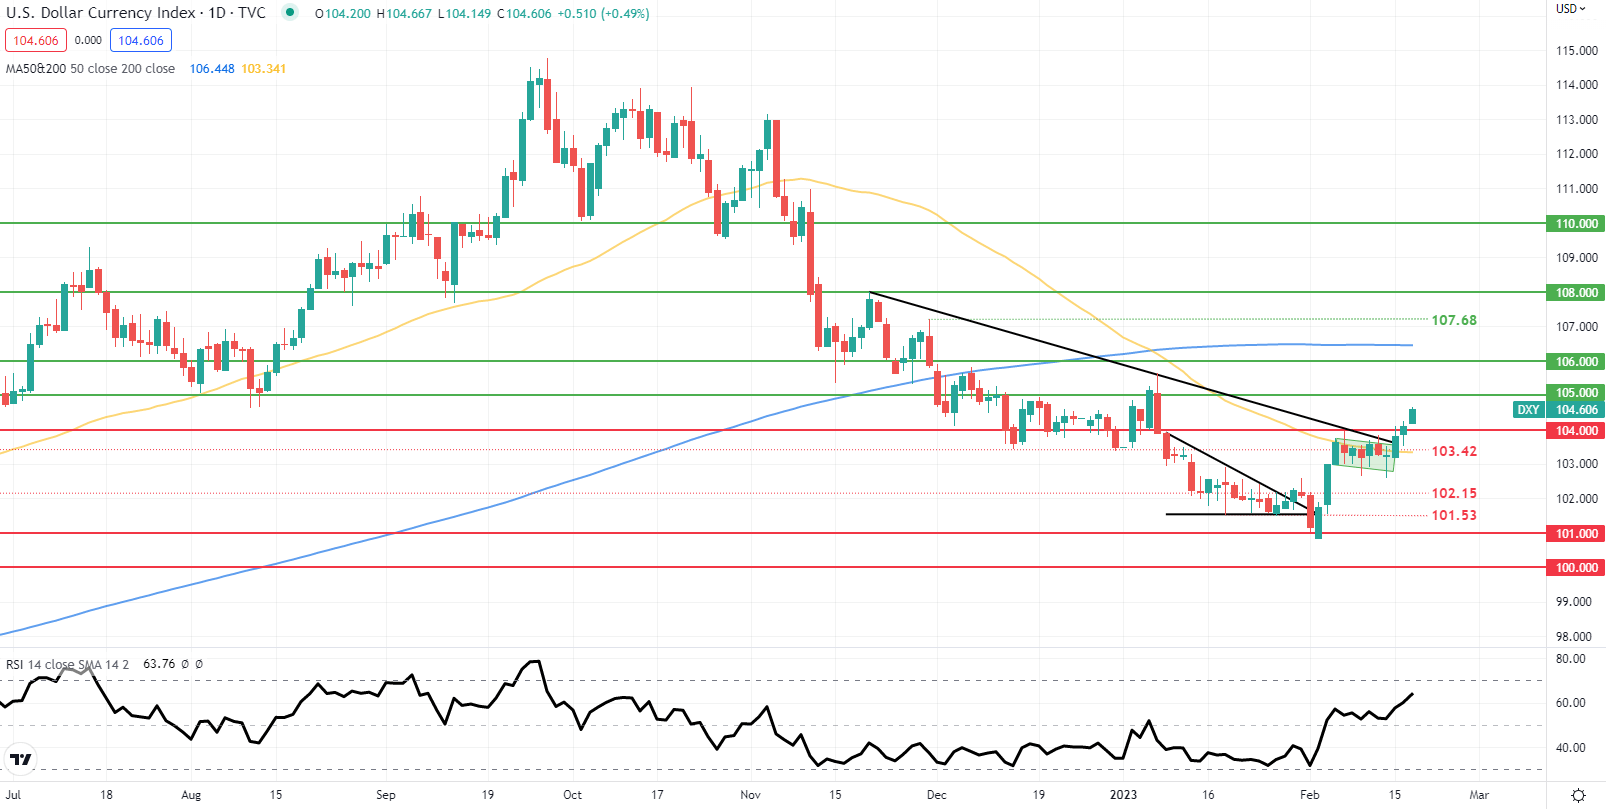
Chart prepared by Warren Venketas, IG
Daily DXY price action has confirmed the move above key resistance in the form of the medium-term trendline (black), the 50-day SMA (yellow) and bull flag resistance (green). This key area of confluence now stands as support with the 104.00 psychological handle being surpassed for the first time since early January 2023. Looking ahead, considering the Relative Strength Index (RSI) is not in overbought territory just yet, there is scope for further upside towards the 105.00 level.
Resistance levels:
- 105.00
Support levels:
- 104.00
- 103.42/50-day SMA
Contact and followWarrenon Twitter:@WVenketas


