


U.S. DOLLAR ANALYSIS & TALKING POINTS
- Increasingly aggressive Fed guidance has bolstered the DXY, rangebound movement expected throughout today.
- Fed’s Cook and S&P PMI data under the spotlight later today.
- DXY awaits triangle breakout.

USD FUNDAMENTAL BACKDROP
The Dollar Index (DXY) has managed to trade marginally higher this Friday morning as we enter the European session. In what has been a muted Asian session, the greenback has found support from hawkish Fed speak last night. The Fed’s Mester (known hawk) and Harker both echoed similar sentiments around maintaining a restrictive monetary policy environment preferring rates above the 5% mark to quell elevated inflation in the US. Money markets tend to agree with these comments with the Fed funds futures below indicating a peak rate of 5.105% at present.
FEDERAL RESERVE INTEREST RATE PROBABILITIES
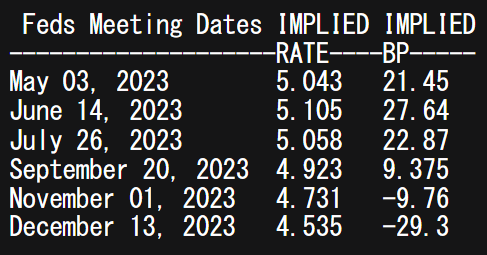
Source: Refinitiv
Looking ahead, the economic calendar is relatively muted barring S&P PMI figures for the US which carries less weight than the ISM report but still heightened in it’s release today with no other market moving events scheduled. To close out the trading session, the Fed’s Cook will come into focus by way of consistency in narrative from prior speakers throughout the week.
Trade Smarter - Sign up for the DailyFX Newsletter
Receive timely and compelling market commentary from the DailyFX team
ECONOMIC CALENDAR
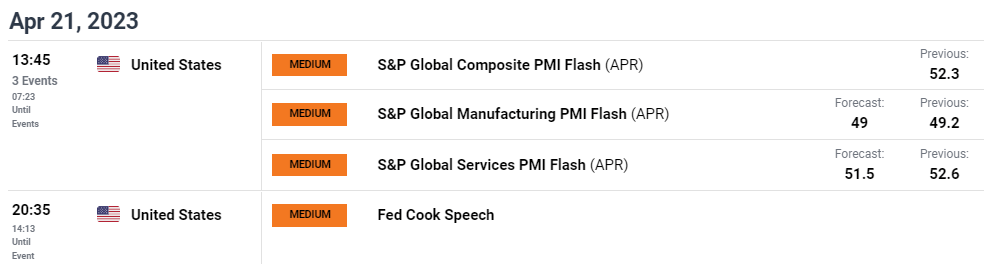
Source: DailyFX economic calendar
TECHNICAL ANALYSIS
U.S. DOLLAR INDEX DAILY CHART
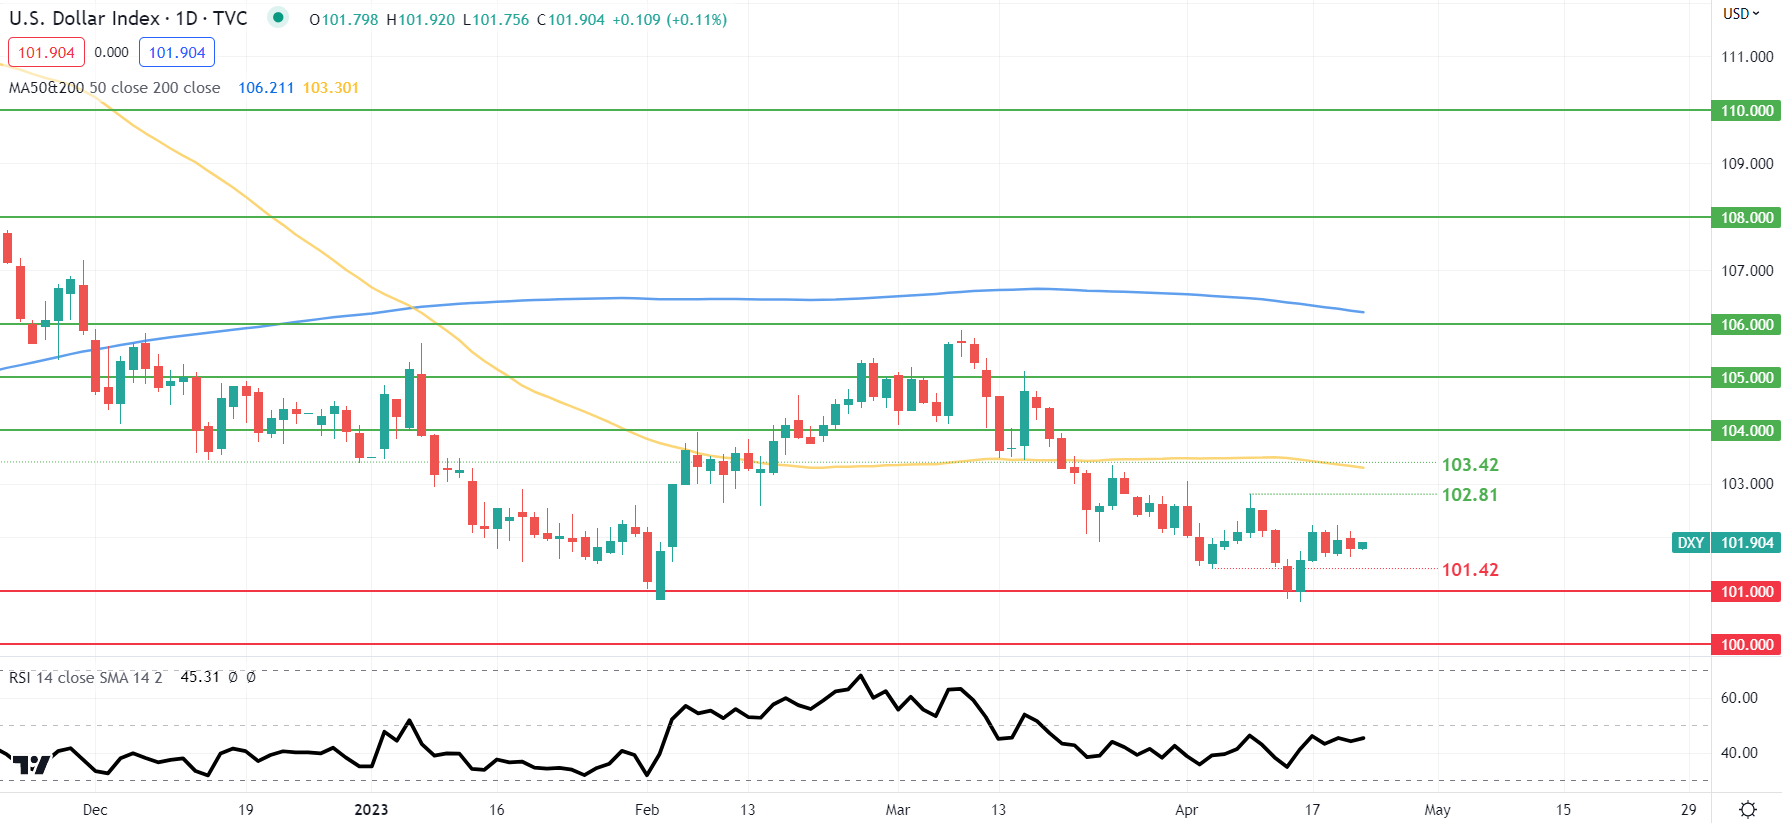
Chart prepared by Warren Venketas, IG
Daily DXY price action shows a consolidating sideways movement resembling a symmetrical triangle type formation. This typically, can break in either direction but often favors the prevailing trend. The Relative Strength Index (RSI) is not providing much in the way of a directional bias but could find its footing next week amidst a slew of US economic data.
Resistance levels:
- 103.42/50-day MA (yellow)
- 102.81
Support levels:
- 101.42
- 101.00
Contact and followWarrenon Twitter:@WVenketas


