


USD/CAD ANLAYSIS & TALKING POINTS
- OPEC+ supply disturbance sees USD bid on higher inflation expectations.
- PMI’s dominate the economic calendar for both Canada and the US.
- High breakout potential this week for USD/CAD.

USD/CAD FUNDAMENTAL BACKDROP
The Canadian dollar is marginally weaker against the USD this Monday morning but comparatively stronger than most of its G10 counterparts on the back of a surprise production cut announcement by OPEC+. The systemic impact on global economies particularly those who have been struggling to quell inflation are likely to be the hardest hit. From a CAD point of view, the oil linked currency has benefitted somewhat from the sharp rise in crude oil prices but has been limited by the higher probability of a Fed interest rate hike as inflation concerns grow.

Later today, the economic calendar begins with the Canadian S&P Manufacturing PMI report that have been gradually increasing and if sustained may provide a further cyclical boost after last week’s positive GDP data. The contrary is true for US Manufacturing PMI data as the US economy has yet to move out of contractionary territory (< 50) – it is important to note that financial markets place more emphasis on the ISM report as opposed to the S&P report for the US.
USD/CAD ECONOMIC CALENDAR
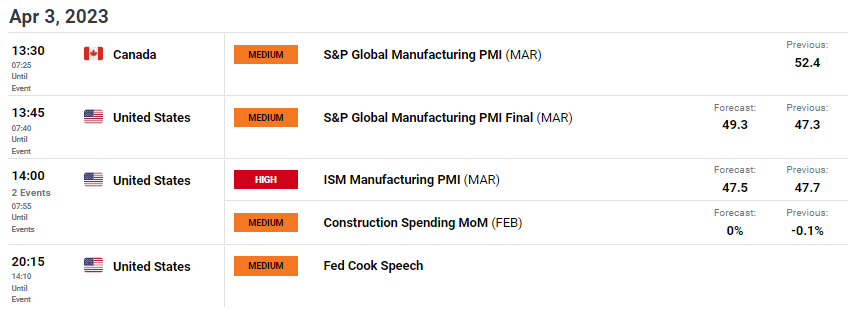
Source: DailyFX Economic Calendar
TECHNICAL ANALYSIS
Trade Smarter - Sign up for the DailyFX Newsletter
Receive timely and compelling market commentary from the DailyFX team
USD/CAD WEEKLY CHART
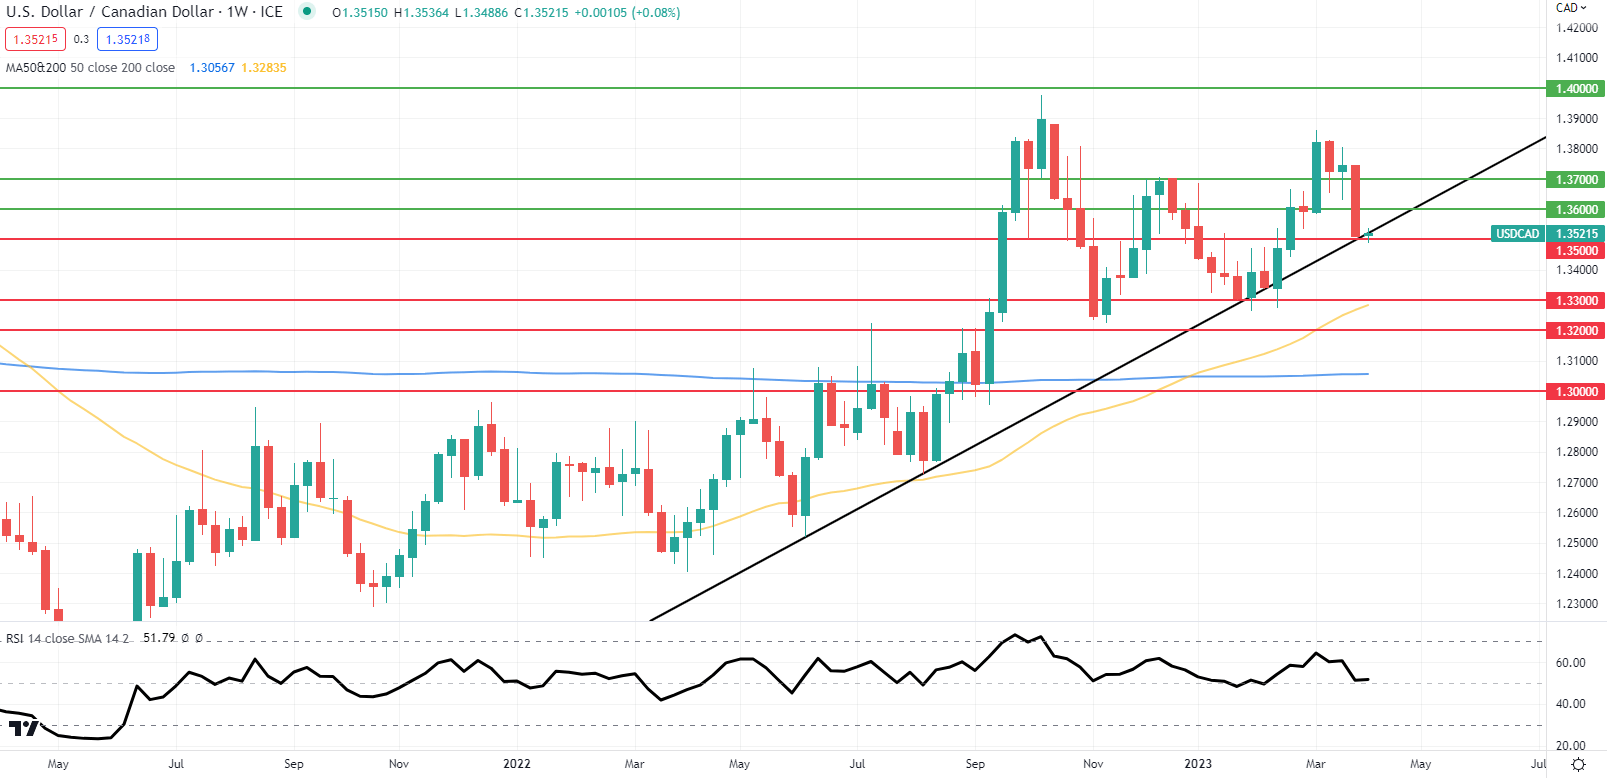
Chart prepared by Warren Venketas, IG
After its best trading week for CAD against the greenback since October 2022, price action on the weekly USD/CAD chart above shows bears piercing the long-term trendline support zone (black) for the 3rd time this year. The level coincides with the 1.3500 psychological handle and a confirmation weekly close could open up the loonie to further downside in the weeks to come.
Key resistance levels:
- 1.3700
- 1.3600
Key support levels:
- 1.3500/Trendline support
- 1.3300
- 50-day SMA (yellow)
IG CLIENT SENTIMENT DATA: BEARISH
IGCS shows retail traders are currently LONG on USD/CAD , with 62% of traders currently holding long positions (as of this writing). At DailyFX we typically take a contrarian view to crowd sentiment resulting in a short-term downside bias.
Contact and followWarrenon Twitter:@WVenketas


