


GOLD POTENTIAL DOWNSIDE CONTINUATION
- Short-Term Pullback in Gold (XAU/USD) May Provide Excellent Short Opportunities.
- 50-Day MA Around the $1982 Handle Could Prove Key.
- The analysis in this article makes use of chart patterns and key support and resistance levels. For more information visit our comprehensive education library
Trade Smarter - Sign up for the DailyFX Newsletter
Receive timely and compelling market commentary from the DailyFX team
GOLD OUTLOOK
Markets have been at the whim of continued uncertainty around the US debt ceiling for the majority of the week. It has been a quiet week in terms of risk events on the economic docket leaving market sentiment as the key driver of price action.
Gold has been no different suffering from the effects of the continued talks around the debt ceiling which has facilitated the strength seen in the US dollar. However, there were signs from a technical perspective that Gold bulls were slightly exhausted and the time for a significant pullback may be approaching.
The precious metals failure to sustainably hold above the $2000 handle hinted at the vulnerability of Gold to a potential deeper retracement. However, it's not all sad as the resulting selloff seen this week has opened up a host of opportunities both long and short with a shorter-term intraday outlook still preferred.
POTENTIAL SETUPS
XAU/USD Daily Chart – May 18, 2023
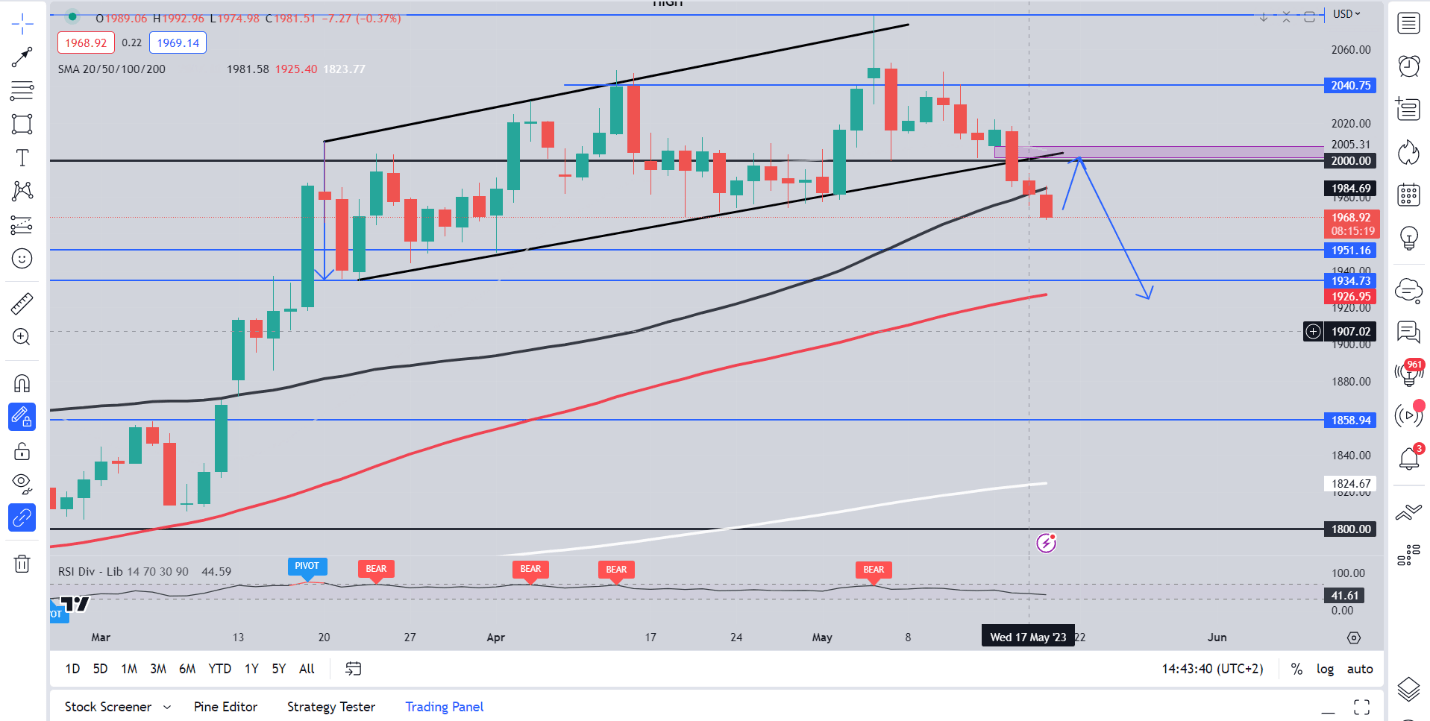
Source: TradingView
Looking at Gold on the daily timeframe we can see a break of the ascending channel and push lower, currently trading below the 50-day MA. I have an overall short bias on gold as I think we are due for a deeper retracement.
However, shorting from here given the decline we have seen already would make little no sense which is why I would like a retracement back toward the psychological $2000 level. An ideal entry area would be around the $2000-$2005 levels (indicated by the pink block on the chart) with a long-term target down at the 100-day MA around the $1926 handle. This is more of an ambitious swing trading idea and contradicts my comments above about a short-term outlook. However, given the fundamental and technical pictures developing a further push to the downside remains favored. A daily candle close above the $2020 handle would invalidate the bearish bias.
XAU/USD One-Hour Chart – May 18, 2023
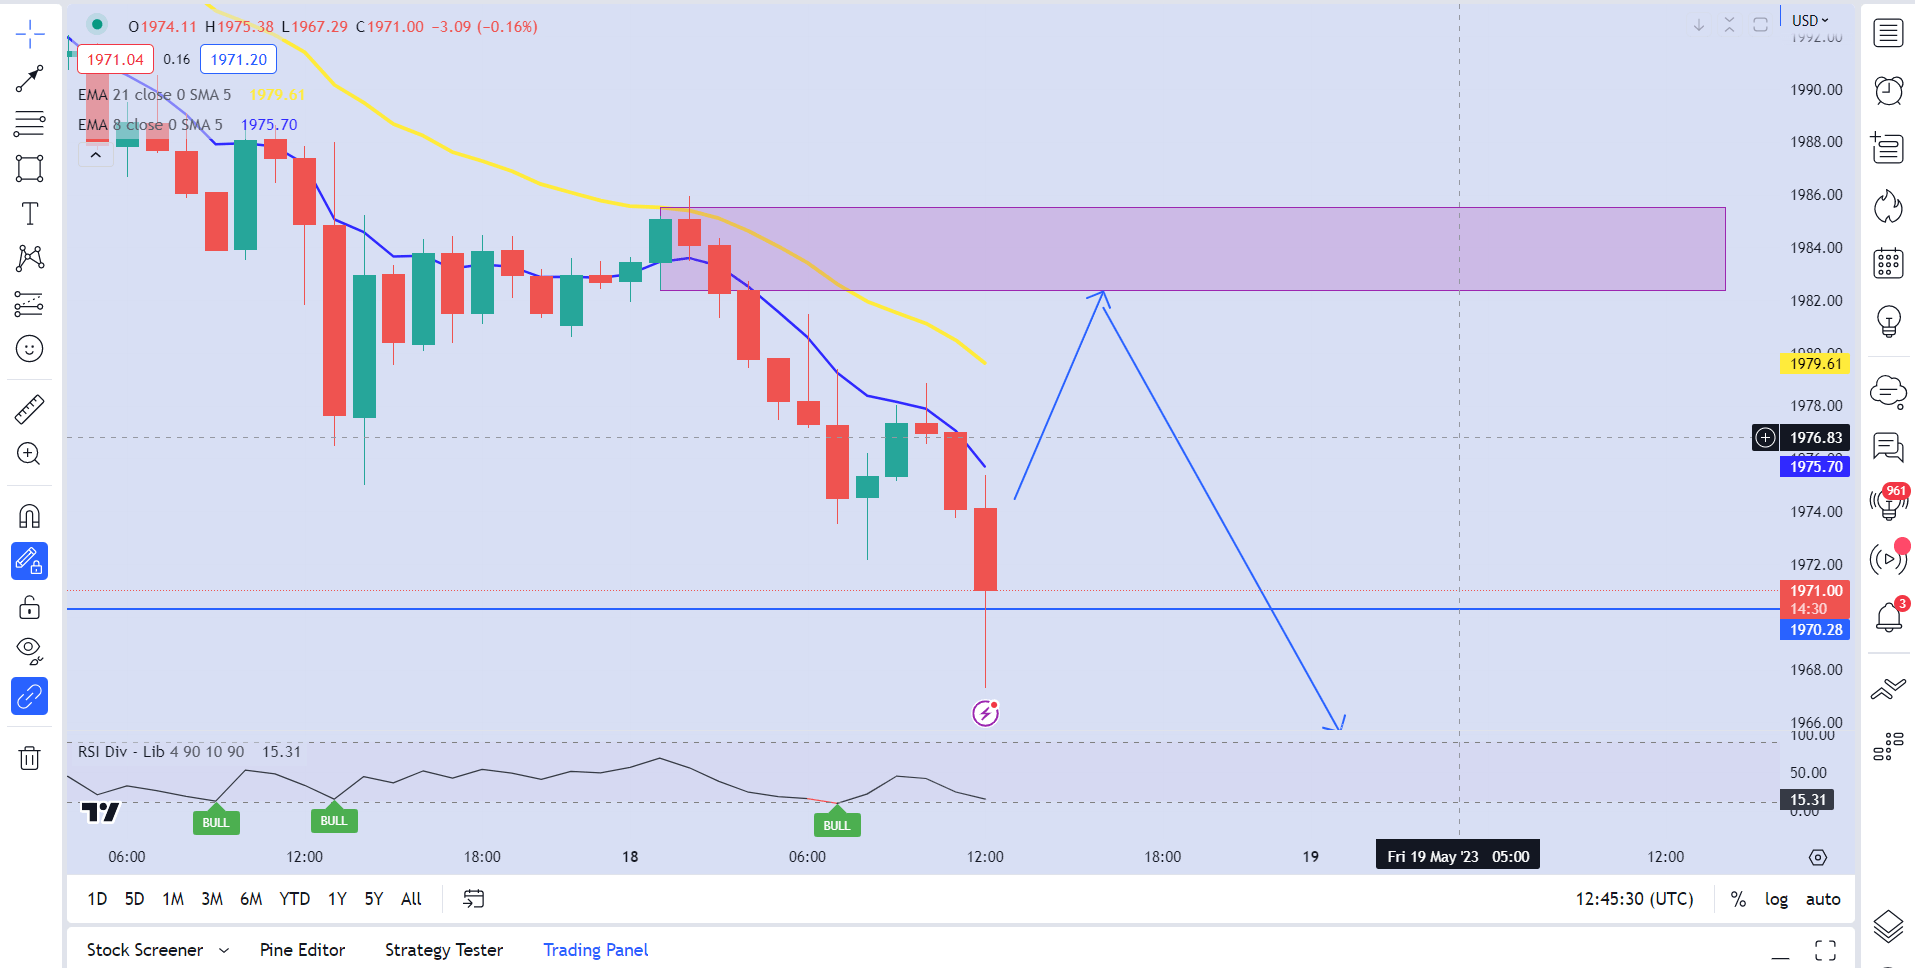
Source: TradingView
On the H1 chart above we have an intraday opportunity for those with a bigger risk appetite. The 50-day MA on the daily rests around the $1983 mark which lines up with the H1 resistance area (pink block on the chart above) and could provide a good entry opportunity for intraday traders eyeing a potential short position.
I would prefer a retest to occur either today or at the latest tomorrow for this setup to remain relevant. The reason I have shared this as mentioned above is we may not get a deep pullback toward the $2000 psychological level and there is still considerable room for further downside. Short side targets would be around $1960, $1950 and the last target at $1926.

Written by: Zain Vawda, Market Writer for DailyFX.com
Contact and follow Zain on Twitter: @zvawda


