


NASDAQ 100 KEY POINTS:
- Downside Breakout May be Imminent.
- Trendline Break Would provide Much Needed Confirmation Following Choppy Price Action.
- Recent Batch of US Data Hints at a Higher Terminal Rate, Supporting a Bearish Narrative for US Indices.
- To Learn More About Price Action, Chart Patterns and Moving Averages, Check out the DailyFX Education Section.

NASDAQ 100 OUTLOOK
The Nasdaq 100 has enjoyed an explosive bullish rally to begin 2023. At the beginning of January markets seemed optimistic that the US Federal Reserve would begin cutting rates in the second half of 2023 thereby providing equities with a boost. As the weeks have progressed, more and more data from the US has seen the probability of a rate cut later in the year continue to fall. Federal Reserve policymakers meanwhile have continued to warn of the need for higher rates for a longer period with yesterday’s inflation print and today’s retail sales data a further sign that the Fed may be able to achieve a higher peak rate in order to tame inflation.
Following the recent batch of earnings releases we have seen the tech sector continue with layoffs in an effort to combat expenditure and improve profitability. This should bode well for tech stocks moving forward in the medium term. However, looking over the next month or two and given the explosive start to 2023 coupled with the technicals developing, a pullback in prices is looking ever more likely. The only question is how deep a pullback should we expect?

TECHNICAL OUTLOOK
From a technical perspective, the Nasdaq weekly candle closed as a bearish inside bar hinting at downside this week, while we also have the double top pattern which remains in play.
NASDAQ 100 Daily Chart – February 15, 2022
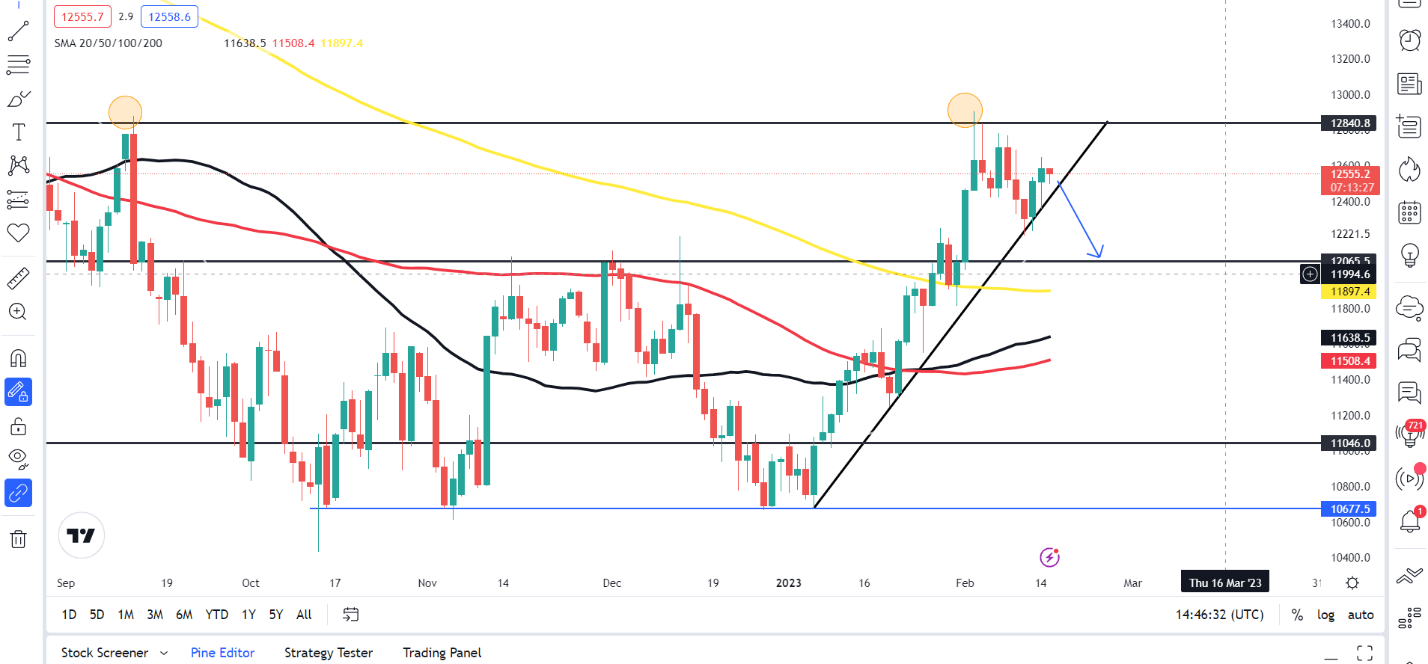
Source: TradingView
Yesterday saw us bounce off the trendline and close as a hammer candle on the daily timeframe which could hint at further upside and a retest of recent highs at the 12890 handle. A retest of the previous highs is not an ideal scenario but may provide potential shorts with a better risk to reward.
NASDAQ 100 Four-Hour Chart – February 15, 2022

Source: TradingView
On the four-hour chart price action is a bit clearer and we have printed lower highs and lower lows since February 2. Price has been consolidating this week inside the pink rectangle visible on the 4H chart, with a candle break and close outside of this zone key to its next move.
Trade Smarter - Sign up for the DailyFX Newsletter
Receive timely and compelling market commentary from the DailyFX team
POTENTIAL SCENARIOS
Looking at the potential scenarios that may develop over the coming days, a candle break and close below the trendline would be optimal to signal further downside at this stage with a riskier approach being the 4H candle close below the consolidation rectangle/block.
A break to the upside and a retest of the recent highs at 12890 may provide potential shorts with the best risk to reward but remain a higher risk opportunity as price action would have then shifted bullish on the 4H timeframe.
KEY RESISTANCE LEVELS:
- 12640
- 12775
- 12890
KEY SUPPORT LEVELS:
- 12479
- 12300
- 12060
Written by: Zain Vawda, Market Writer for DailyFX.com
Contact and follow Zain on Twitter: @zvawda


