


The fundamental backdrop for gold as we head into Q2 of 2023 may be shifting by way of a less hawkish Federal Reserve. That being said, calling a dovish Fed may be too early to call with other economic factors creating a push/pull effect for the US central back, thus making their job that much harder to achieve price stability.
Trade Smarter - Sign up for the DailyFX Newsletter
Receive timely and compelling market commentary from the DailyFX team
XAU/USD TECHNICAL ANALYSIS
SPOT GOLD WEEKLY CHART
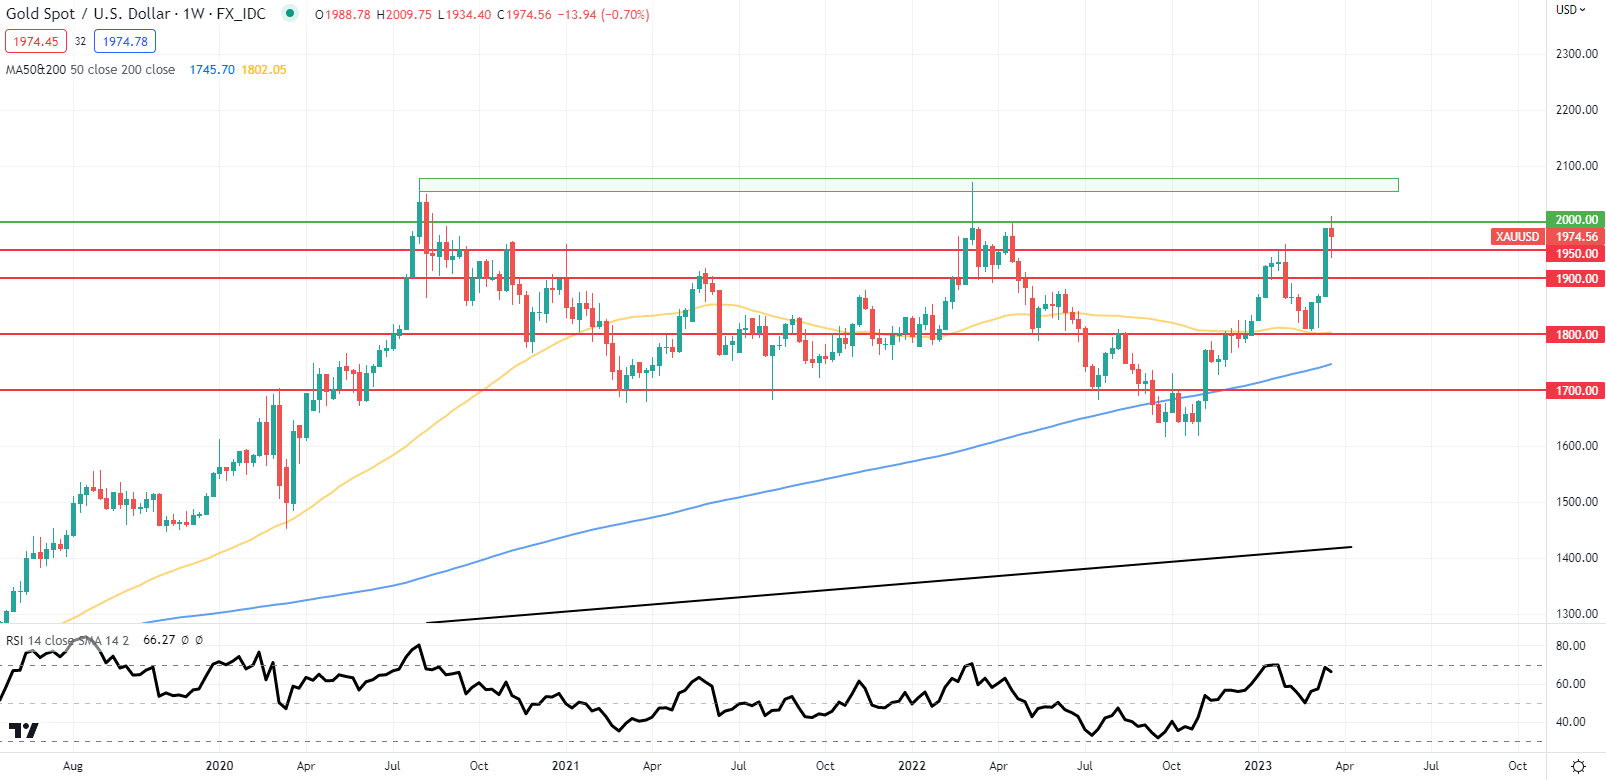
Chart prepared by Warren Venketas, IG
Looking at the longer-term weekly chart for gold, the 1950.00 resistance handle (now support) has been breached for the second time this year. With more conviction this tie round, a rally up towards the 2070 2075 zone (green) is not unlikely. If we look at the Relative Strength Index (RSI), there are signs of bearish divergence and could indicate a possible move lower as price action and the RSI extend their opposing travels. Although an initial move higher is on the cards, by the end of Q2 there may well be a pullback towards 1950 and beyond. The 50-day (yellow) and 200-day (blue) moving averages are quietly converging and may form a death cross in due course, once again exposing XAU/USD to further downside.
SPOT GOLD DAILY CHART
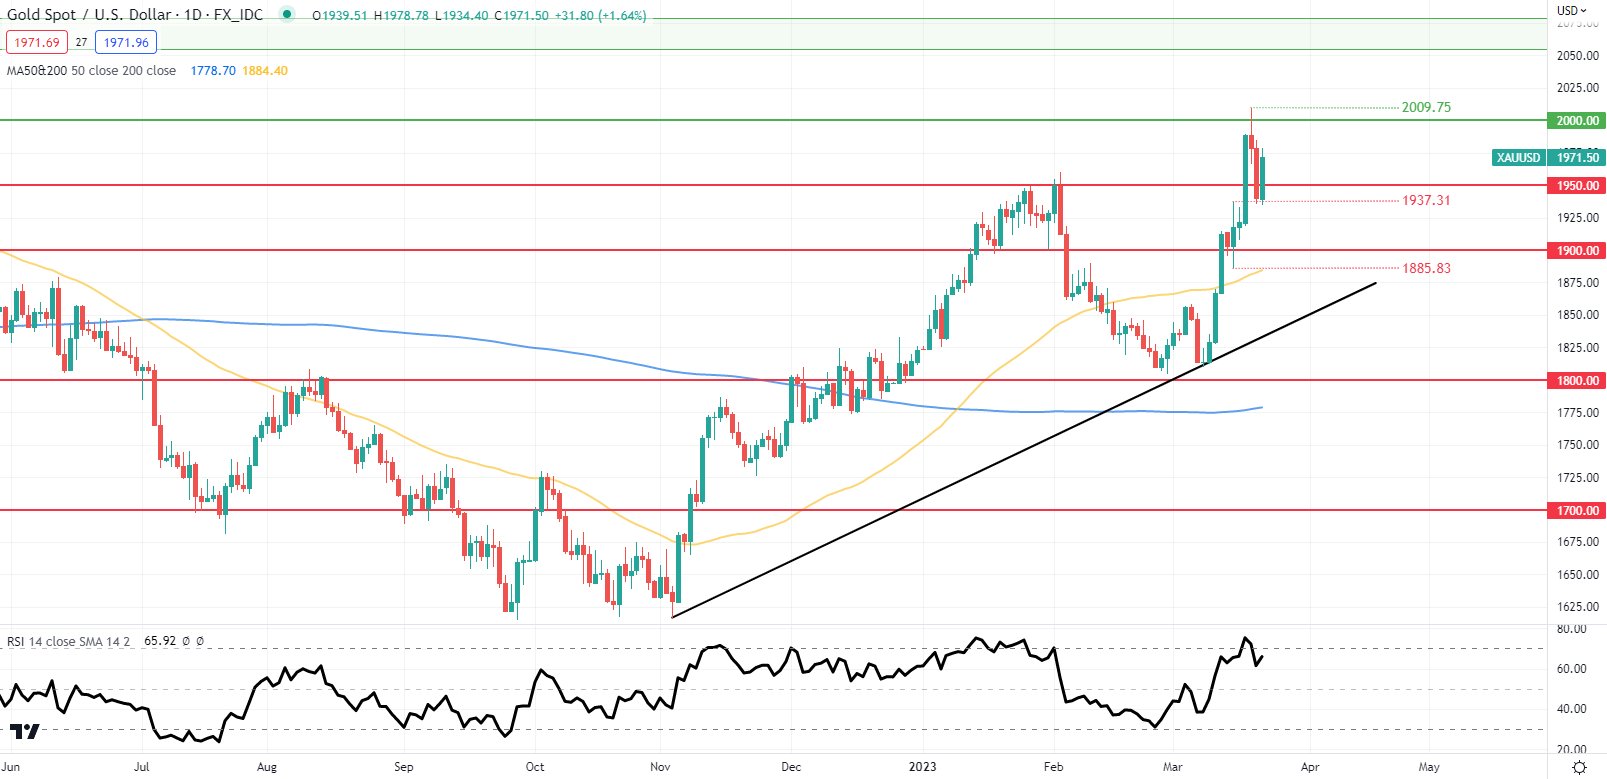
Chart prepared by Warren Venketas, IG
Focusing in on the daily chart above, the short-term bias remains firmly in favor of gold bears with the RSI in overbought territory. The difficulty lies in forecasting over a 3 month period and with so much impactful economic data to come, the long-term outlook can be blurry. Revising the technical analysis above periodically will ensure a fresh look as and when new data hits the market, giving a more accurate viewpoint. My personal view should see gold persist between the 1900 – 2100 zones leaving Q3 with the potential to move the needle in a more significant manner.
Key resistance levels:
-2070.00 – 2075.00
-2009.75
-2000.00
Key support levels:
-1950.00
-1937.31
-1900.00
-1885.83/50-day SMA
-Trendline support
Contact and follow Warren on Twitter @Wvenketas


