


GBP/USD PRICE, CHARTS AND ANALYSIS:
- Cable Holding onto Asian Session Gains around 1.2350.
- UK Retail Sales Rebound Following a Rain Affected March Figure.
- RSI Entered Oversold Territory Supporting a Deeper Retracement.
- To Learn More About Price Action, Chart Patterns and Moving Averages, Check out the DailyFX Education Section.
Trade Smarter - Sign up for the DailyFX Newsletter
Receive timely and compelling market commentary from the DailyFX team
READ MORE: Gold Price Forecast: $1950 Level Holds Key for Bearish Momentum to Continue
The UK recorded a hot inflation print this week with hawkish repricing of the Bank of England’s (BoE) peak rate probabilities unable to arrest Cables slide as persistent US dollar strength continued. GBPUSD has enjoyed a decent bounce in the Asian session from lows around the 1.2300 mark, currently trading at 1.2340. Much like the rest of the week the question remains whether cable can hold onto its gains as the day progresses.
UK RETAIL SALES
The UK released retail sales data this morning for the month of April which validated the ONS claims that poor retail sales in March was down to heavy rains. The figure for April came in at 0.5% rebounding from a fall of 1.2% in March with signs that UK retailers may look ahead with a bit more confidence. Sales volumes rose by 0.8% in the three months to April 2023, the highest rate August 2021 which came in at 1.3%.
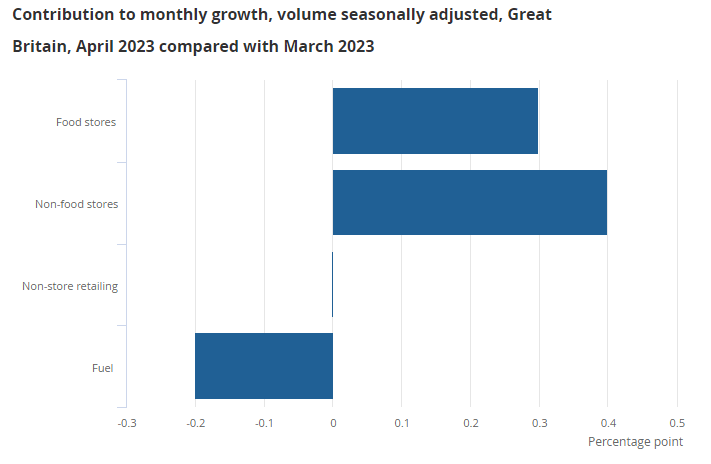
Source: ONS, Retail sales, Great Britain: April 2023
*NOTE: The graph above shows the contributions to the 0.5% month-on-month rise in overall retail sales volumes (quantity bought) in April 2023.
US FACTORS AND EVENT RISK
The US dollar meanwhile which has largely been the driving force behind cables move continues to hold firm which should continue as long as a deal on the US debt ceiling remains unresolved. There has been some positive rhetoric but none that would suggest a deal is imminent with next week going to be key as the June 1 deadline approaches.
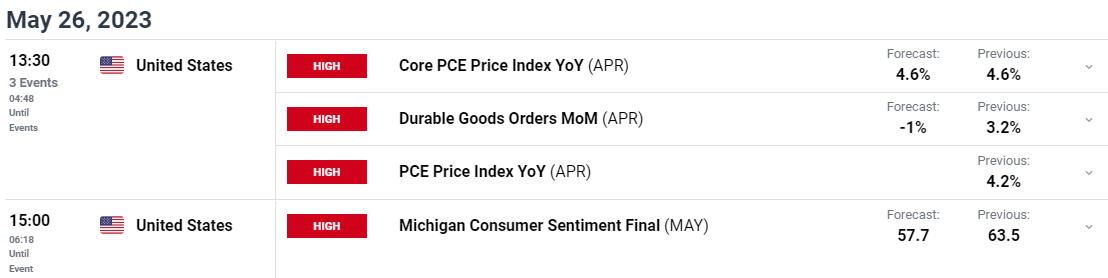
The day ahead will see focus shift to the all-important Core PCE data out of the US, which remains the Federal Reserves preferred gauge of inflation. This comes on the back of largely positive data out of the US yesterday with GDP Growth QoQ estimates beating forecast while initial and continuous jobless claims beat estimates as well. Another positive notch for the US on the labor front heading toward the June meeting.
Today's PCE data could lend the US dollar further support should the print come in hotter than expected with the Core PCE Index forecast to come in at 4.6%. A beat of the forecast could back up recent hawkish rhetoric from Fed policymakers regarding potential hikes in June and beyond.
For all market-moving economic releases and events, see the DailyFX Calendar
TECHNICAL OUTLOOK AND FINAL THOUGHTS
On the daily timeframe GBPUSD has continued to tick lower toward the key 100-day MA resting around the 1.2280 handle. This morning’s bounce came as the pair entered oversold territory (14-Day RSI) hitting a high of around 1.2354.
Looking at the intraday potential for GBPUSD and the biggest worry remains the US factors mentioned above which could continue to cap any upside recovery. I do think we may find significant support and a potential bottom around the 100-day MA, but this would rest on the outcome of the PCE data. The range between 1.2360 and 1.2280 (100-day MA) could remain pivotal for intraday moves.
There is a possibility that we could see a continued recovery for the majority of the European session toward yesterday’s high around 1.2388 before a selloff heeding into the US session and data releases.
Key Intraday Levels to Keep an Eye Out For
Resistance levels:
- 1.2388
- 1.2448
- 1.2500
Key support levels:
- 1.2310
- 1.2280 (100-day MA)
- 1.2220
GBP/USD Daily Chart – May 26, 2023
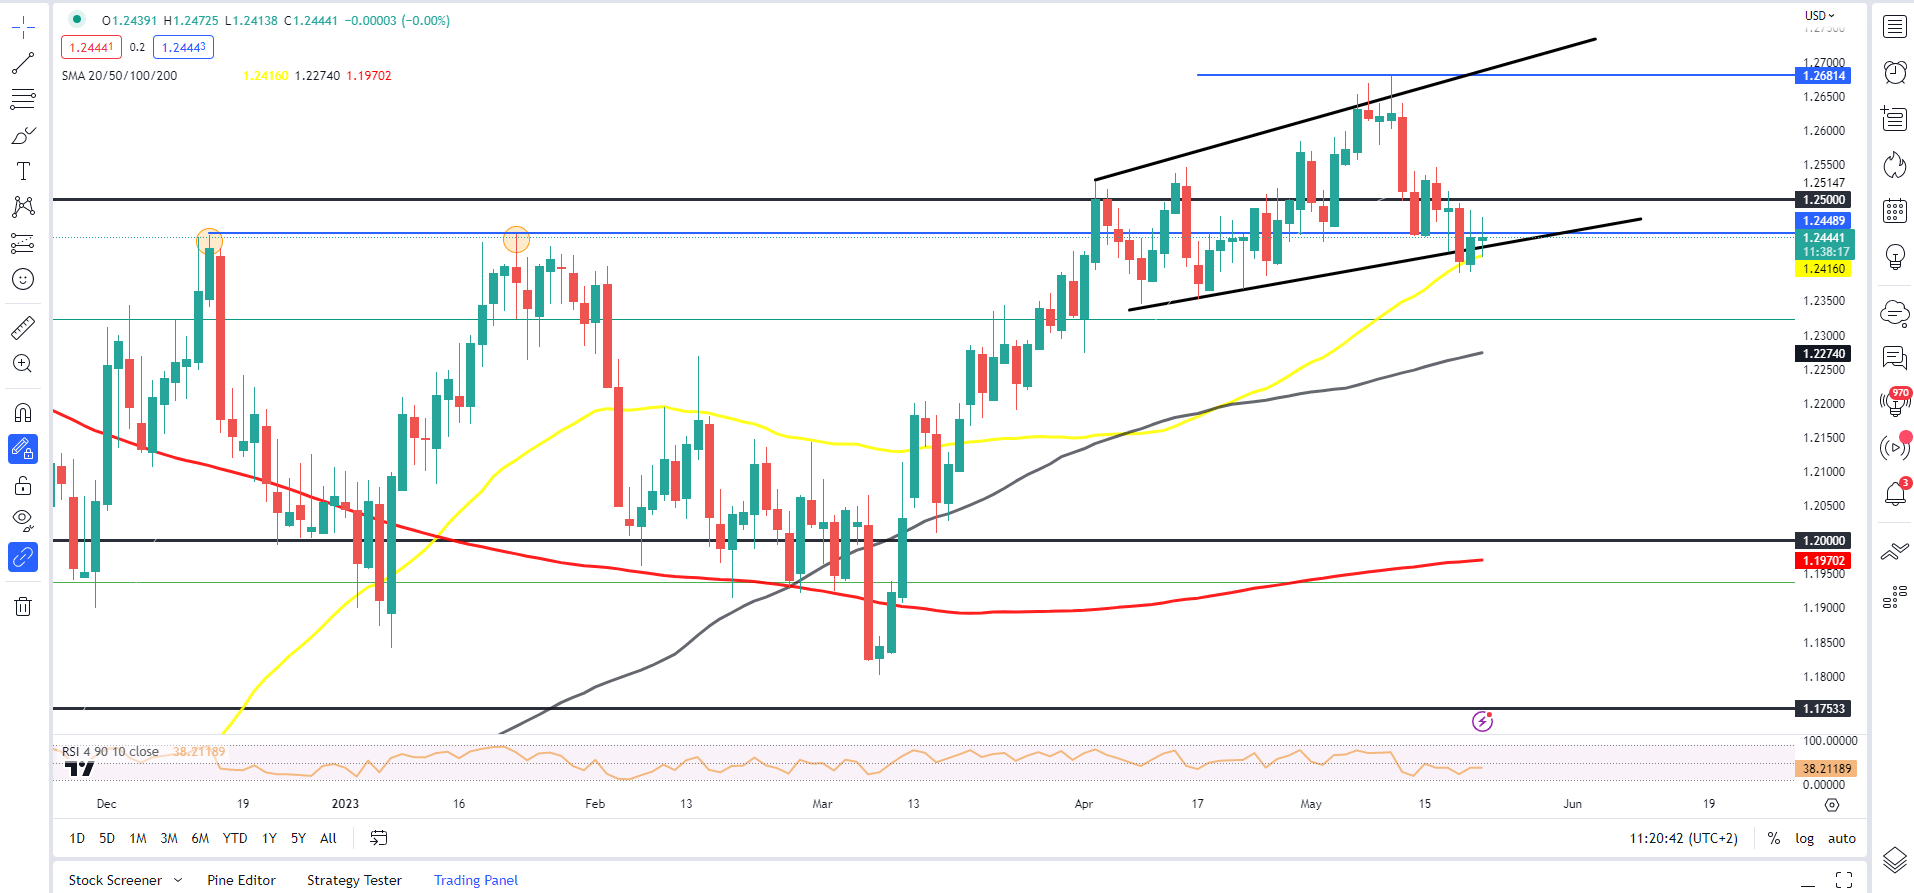
Source: TradingView
Introduction to Technical Analysis
Relative Strength Index (RSI)
Recommended by Zain Vawda
Written by: Zain Vawda, Markets Writer for DailyFX.com
Contact and follow Zain on Twitter: @zvawda


