
GBP/USD & EUR/USD OUTLOOK:
- GBP/USD rallies and challenges a major confluence resistance region
- EUR/USD gains and moves closer to overtaking trendline resistance, a bullish breakout that could pave the way for a retest of January’s high
- DailyFX’s second quarter trading guides are ready. Download them here!

Most Read: US Dollar Q2 Technical Forecast - Sellers Take Hold of Steering Wheel
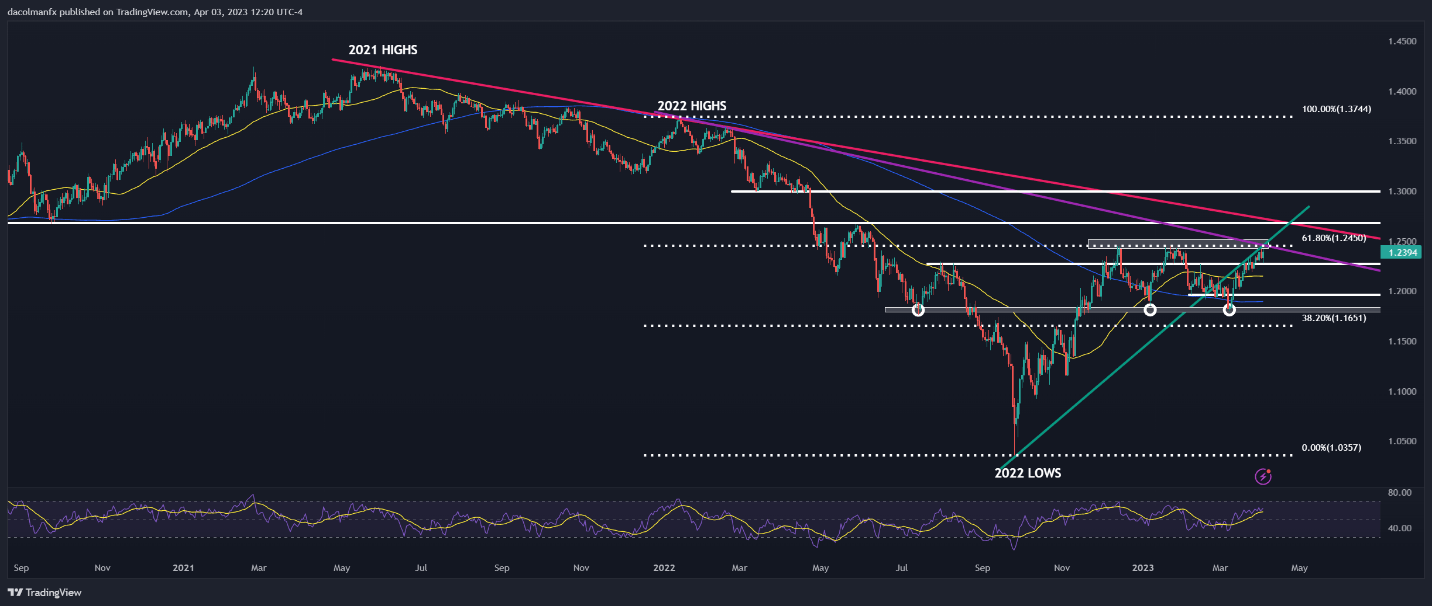
GBP/USD TECHNICAL ANALYSIS
The British pound gained on Monday, bolstered by broad-based U.S. dollar weakness amid falling U.S. Treasury yields on bets that the Fed’s tightening cycle is nearing its end. Against this backdrop, GBP/USD rose about 0.5% to trade slightly below 1.2400, approaching confluence resistance at 1.2450, a technical barrier where the 61.80% Fib retracement of the 2022 slump aligns with the highs of December last year and January this year.
A look at the daily chart shows that bullish momentum has tended to fade around the 1.2450 handle on several occasions over the past four months, leading to a pullback on each occasion. If history were to repeat itself, which is a key premise of technical analysis, cable’s recent advance may be running out of gas. This means that sterling could be on the verge of a downside correction in the coming days.
Should the bearish scenario play out, GBP/USD could pivot lower and head towards 1.2270, prior to challenging 1.2150, the 50-day simple moving average. On further weakness, the next downside target to keep in mind lies at 1.1960. Conversely, if confluence resistance at 1.2450 is breached on higher volume, the bearish case would be invalidated, creating the right conditions for a rally towards 1.2680, just a touch below a long-term descending trendline.
GBP/USD TECHNICAL CHART
GBP/USD Chart Prepared Using TradingView
Related Reading: Euro Q2 Fundamental Forecast - Recovery May Continue but Upside Will Be Limited

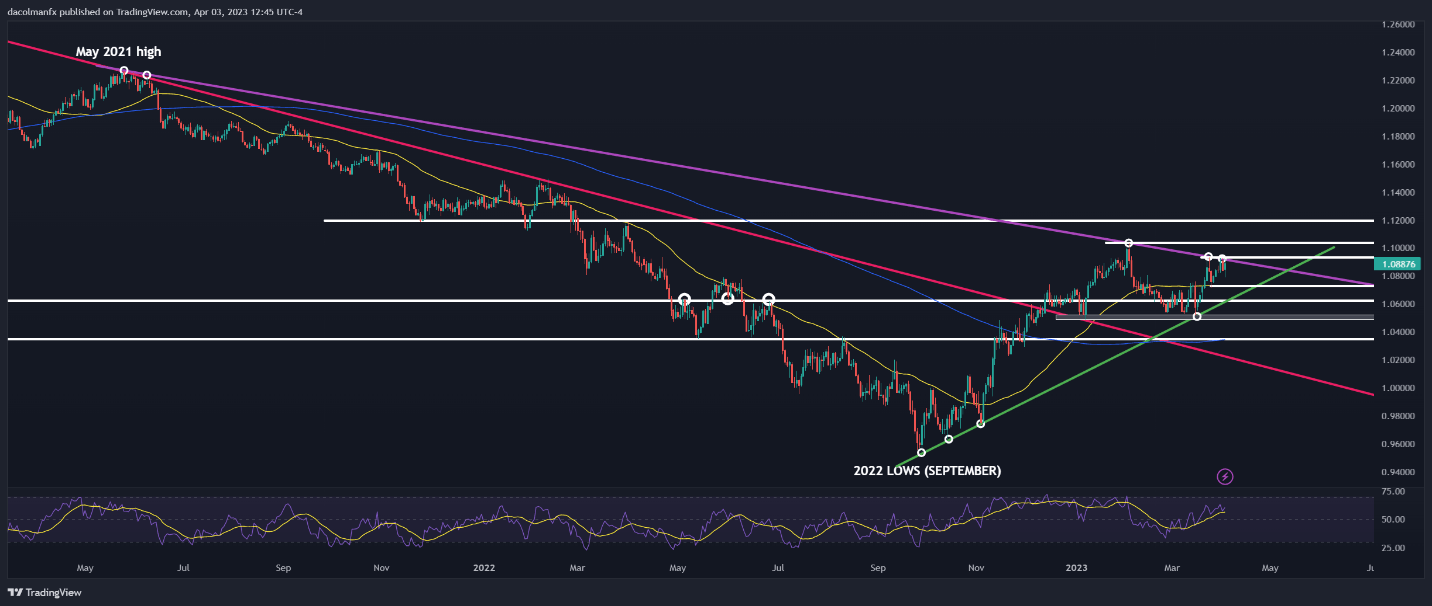
EUR/USD TECHNICAL ANALYSIS
EUR/USD also rallied on Monday, up about 0.5% to 1.0890, supported by the U.S. dollar’s softer tone in the foreign exchange space. After its recent advance, the pair has come within striking distance of overtaking cluster resistance at 1.0930, a technical ceiling created by last month’s highs and a descending trendline in play for nearly two years.
With upward momentum on its side, the euro could be poised for a topside breakout in short order, especially if market sentiment improves further and ECB officials continue to come out in support of forceful monetary policy tightening in response to sticky inflationary pressures in the region.
In the event of a bullish breakout, EUR/USD’s gains are likely to accelerate with more buyers entering the market, paving the way for a retest of this year’s high at 1.1033. On further strength, the next upside target corresponds to the psychological 1.1200 mark.
On the other hand, if sellers regain control and trigger a bearish reversal from current levels, initial support lies at 1.0730, near the 50-day simple moving average. Below this area, the next floor of interest rests at 1.0620, a key support created by a short-term rising trendline in play since September of 2022.
| Change in | Longs | Shorts | OI |
| Daily | 2% | -12% | -3% |
| Weekly | -2% | 11% | 2% |
EUR/USD TECHNICAL CHART