
EUR/USD TECHNICAL OUTLOOK:
- Euro posts moderate losses on Wednesday amid broad-based U.S. dollar strength
- EUR/USD’s technical outlook could turn bearish if sellers validate a double top pattern
- This article looks at key levels to keep an eye on in the near term

Most Read: S&P 500, Nasdaq 100 Struggle for Direction after Red-Hot Retail Sales, High CPI
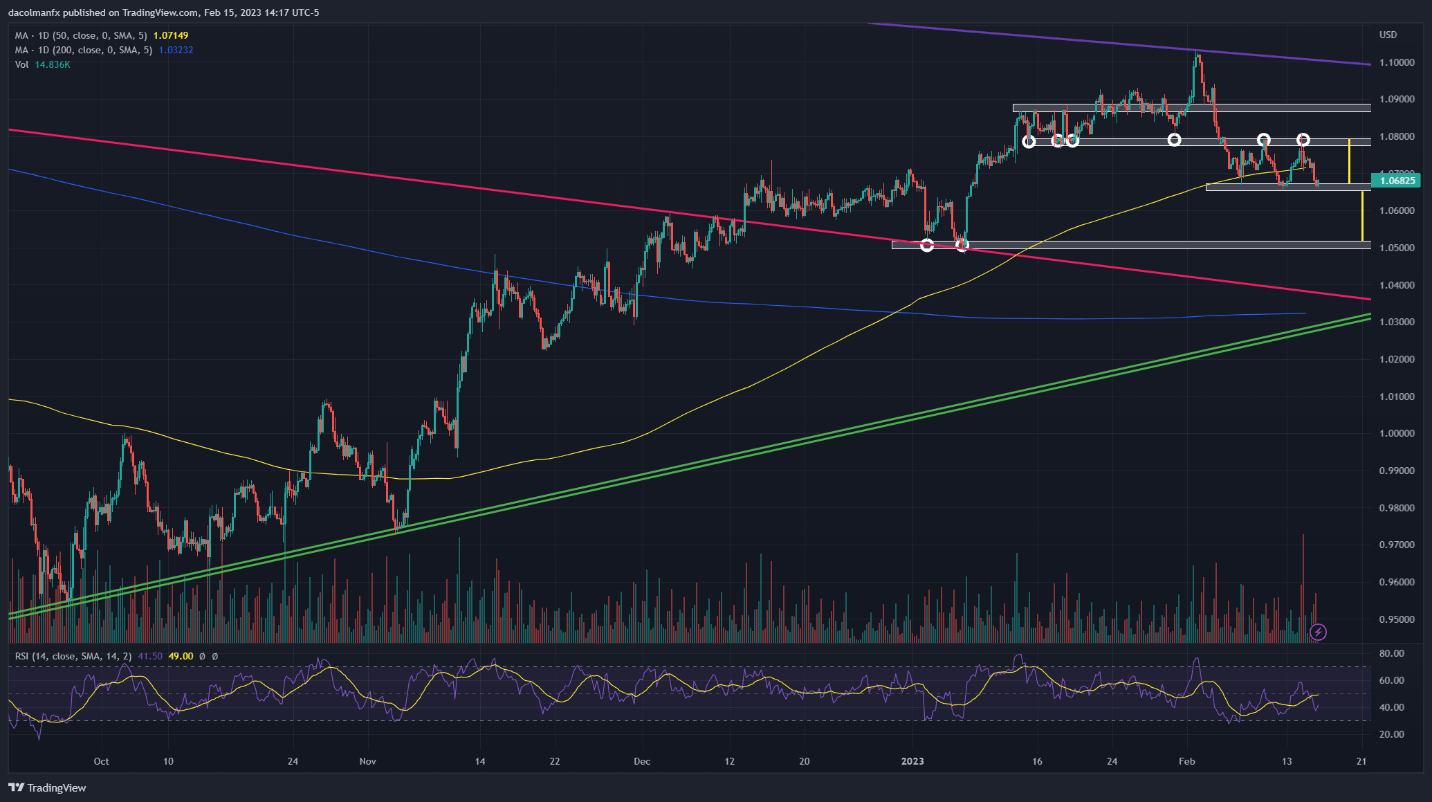
EUR/USD sustained moderate losses on Wednesday amid broad-based U.S. dollar strength, falling around 0.6% to 1.0670, a very important technical region that has acted as a sturdy floor on several occasions over the past couple of weeks.
Although the medium-term outlook remains constructive following the strong rally since September last year, from a technical standpoint there are ominous signs worth watching, namely the recent development of a double top pattern shown in the four-hour chart below.
In the grand scheme of things, the double top formation indicates a weakening buying pressure after a powerful uptrend. This pattern, which resembles the capital letter “M” is composed of two peaks of similar height, divided by an intermediate depression viewed as support (neckline).
This bearish setup is validated once prices pierce below the neckline, especially if the move is accompanied by increased volume, as that could suggest that more sellers are entering the market to bet against the underlying asset. In the case of EUR/USD, neckline support is found in the 1.0670/1.0655 band.
In the coming sessions, traders should keep an eye on how the pair reacts around current levels, but if 1.0670/1.0655 is breached on the downside, the exchange rate could quickly slide towards the psychological 1.0500 level, a target obtained by projecting the height of the double top from the breakdown point.
On the flip side, if the bulls manage to defend support and repel the pair higher, EUR/USD could be on its way to retest the two recent crests hovering slightly below the 1.0800 handle. On further strength, there could be room for a run toward 1.0875.
| Change in | Longs | Shorts | OI |
| Daily | -2% | 1% | -1% |
| Weekly | -15% | 16% | -6% |
EUR/USD TECHNICAL CHART