
EUR/USD AND USD/CAD FORECAST:
- EUR/USD slides on disappointing economic data from Europe
- USD/CAD continues to carve out a bearish double-top pattern
- This article looks at key EUR/USD and USD/CAD’s levels to watch in the coming days

Most Read: Japanese Yen Price Action Setups: EUR/JPY, USD/JPY, AUD/JPY
EUR/USD ANALYSIS
The euro weakened against the U.S. dollar on Tuesday, undercut by disappointing economic data from Europe and rising U.S. Treasury yields. In early afternoon trading, EUR/USD was down about 0.2% to 1.0690, steadily approaching a key support area near the May lows.
Worse-than-expected German factory orders, which declined 0.4% in April, and stagnant retail sales in the Eurozone at the start of the second quarter dampened sentiment by reinforcing fears of a possible recession later in the year.
If Europe's economic outlook deteriorates further, the ECB may be reluctant to forge ahead with additional rate hikes in the coming months, preventing a narrowing of US-EU yield spreads, a key risk for the euro. This is not yet the baseline scenario, but it is something to keep in mind should clouds on the horizon get darker.
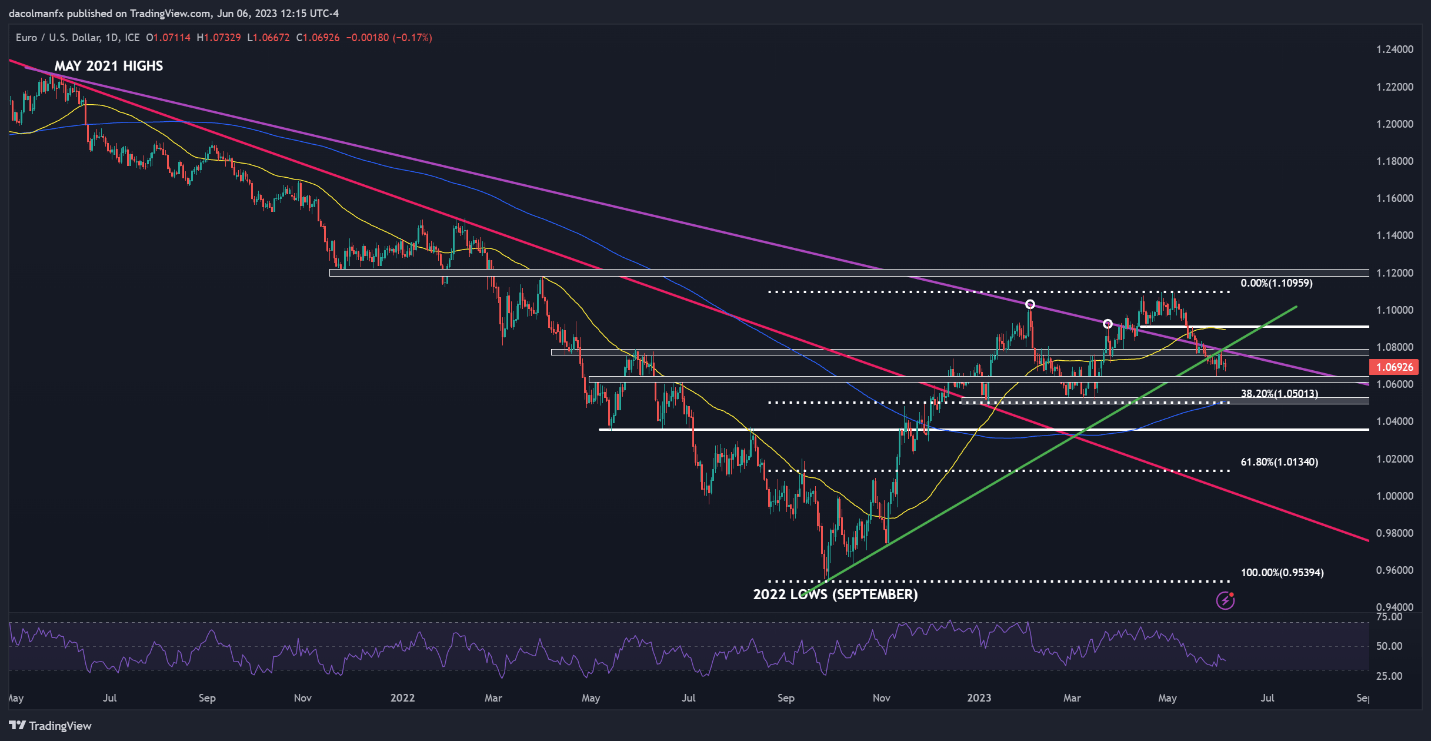
In terms of technical analysis, EUR/USD has corrected sharply lower from its May highs and has invalidated a key trendline early last week, but appears to be stabilizing, with the pair moving between resistance at 1.0750 and support at 1.0640 over the past few sessions, a sign of possible market consolidation.
While EUR/USD’s prospects have become less constructive of late, bulls may still be able to regain the upper hand, but to do so, they need to drive the exchange decisively above overhead resistance at 1.0750. If this scenario plays out, buyers could reinstate the bullish bias ahead of a possible climb toward the psychological 1.0900 handle.
In contrast, if downside pressure gathers pace and prices breach cluster support at 1.0640/1.0600, all bets are off. This breakdown could attract new sellers, paving the way for a pullback toward 1.0500, where the 200-day SMA aligns with the 38.2% Fib retracement of the Sept 2022/May 2023 rally.
| Change in | Longs | Shorts | OI |
| Daily | -7% | 16% | 0% |
| Weekly | -3% | 20% | 4% |
EUR/USD TECHNICAL CHART
| Change in | Longs | Shorts | OI |
| Daily | 27% | -12% | -2% |
| Weekly | 22% | -5% | 2% |
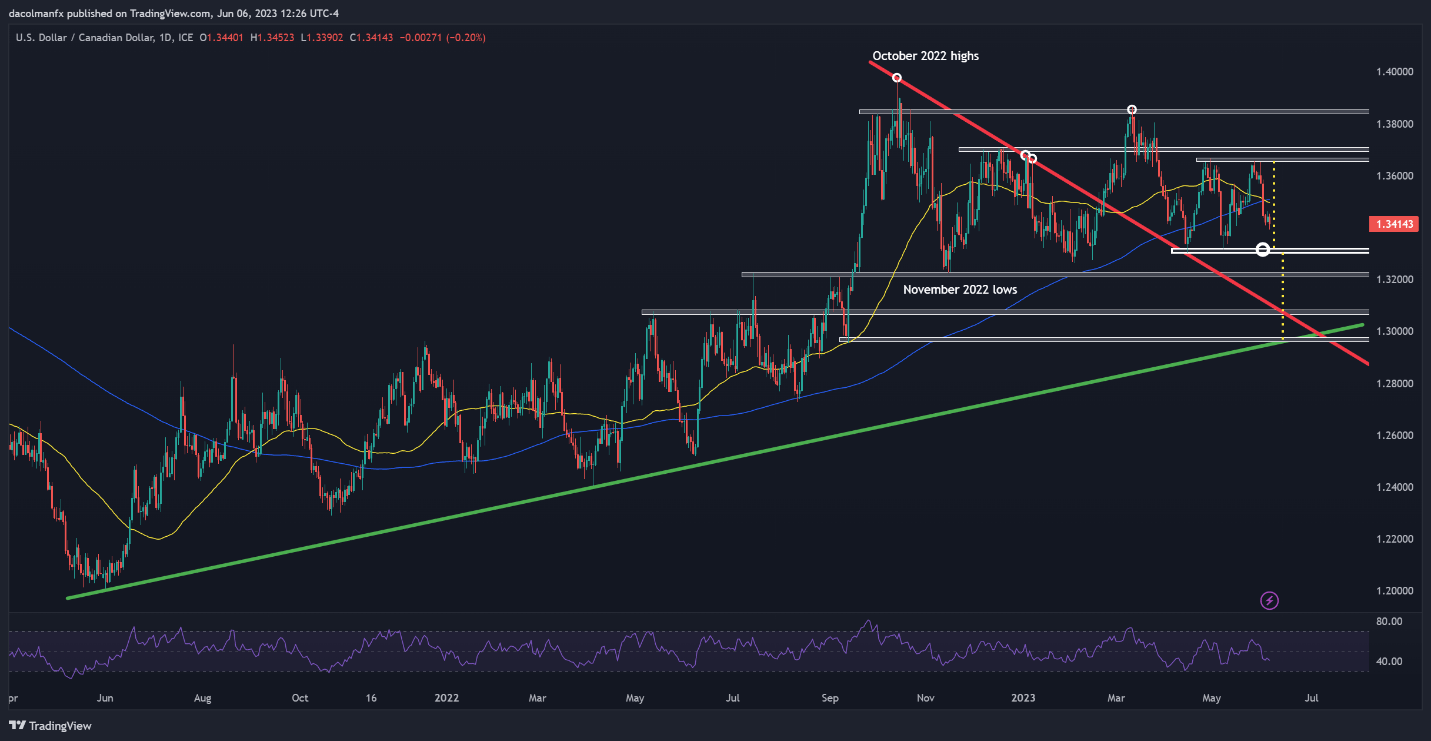
USD/CAD ANALYSIS
Over the past couple of months, USD/CAD has been forging what appears to be a double top, as shown in the daily chart below. A double top is a reversal pattern, composed of two similar peaks separated by a depression that often develops in the context of an extended advance.
This bearish setup is confirmed once the price completes its “M” resembling shape and breaks below the technical support created by the formation intermediate's trough – the neckline. In the case at hand, the neckline sits slightly above the psychological 1.3300 mark.
If the double top is validated, USD/CAD could suffer heavy losses, though this scenario may take time to unfold. Anyhow, the size of the potential downward move can be obtained by projecting vertically the height of the formation from the break point. For the pair, this could mean a slump toward 1.2960.
USD/CAD TECHNICAL CHART