
EUR/USD TECHNICAL ANALYSIS
The euro appreciated considerably against the US dollar between March and early May, but the upward momentum faded and the tables turned in the blink of an eye after prices failed to break above the psychological level of $1.1100, a key technical ceiling worth keeping a close eye on.
In recent weeks, EUR/USD probed the $1.1075/$1.1100 band multiple times, but was repelled lower on every single occasion, with the pair in retreat and trading at $1.0825 on Wednesday afternoon following its last unsuccessful attempt to clear overhead resistance.
Although the outlook remains positive, euro bulls have valid reasons to worry as the exchange rate appears to be heading towards confluence support at 1.0820/1.0785 at the time of writing. For the uptrend to resume, this floor needs to hold; otherwise, a pullback towards 1.0705 could be in the cards.
In contrast, if EUR/USD establishes a base around the 1.0800 handle and bounces off those levels, initial resistance lies at 1.0910. A sustained move above this barrier could lure new buyers to the market, emboldening them to make another go on the 2023 highs.

EUR/USD TECHNICAL CHART
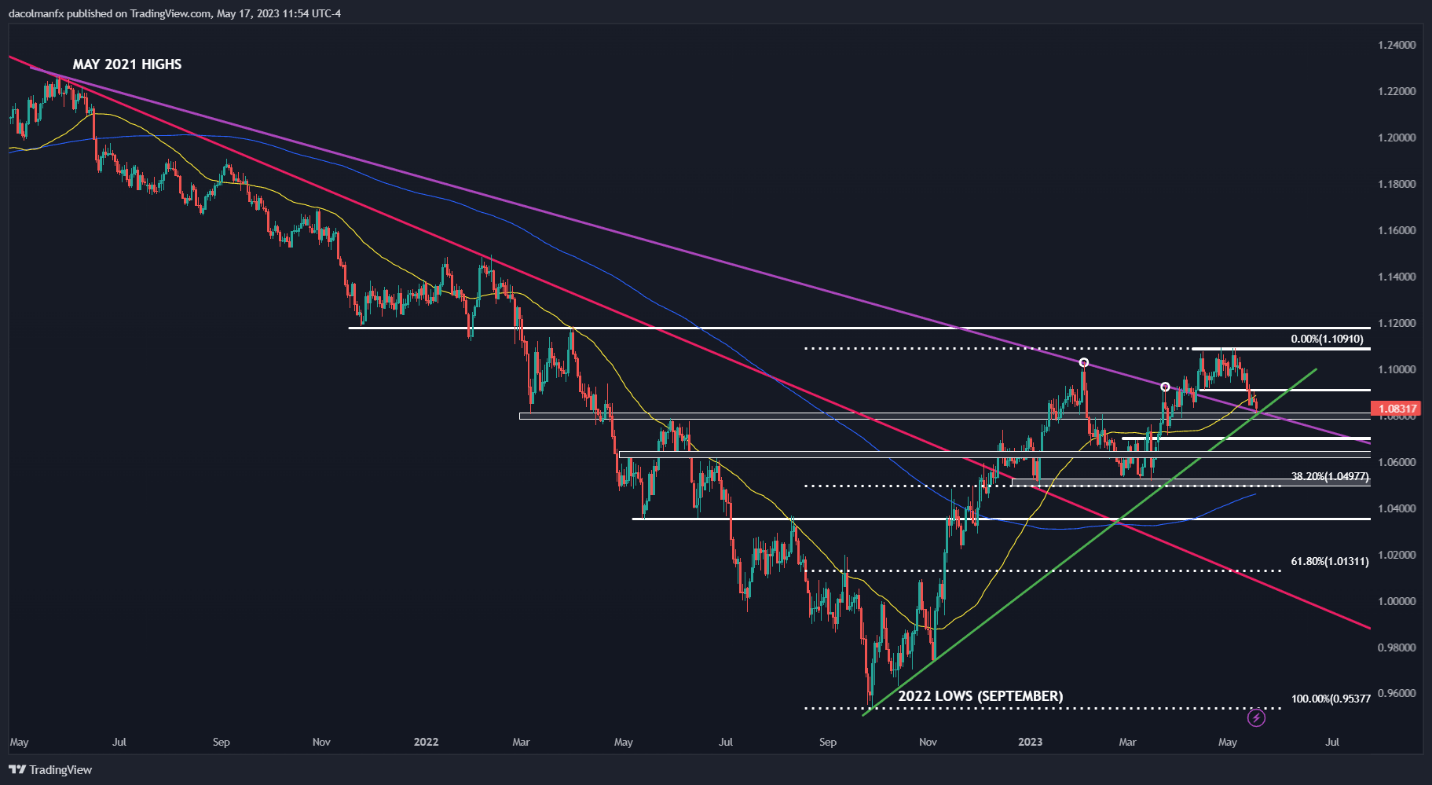
EUR/USD Chart Prepared Using TradingView

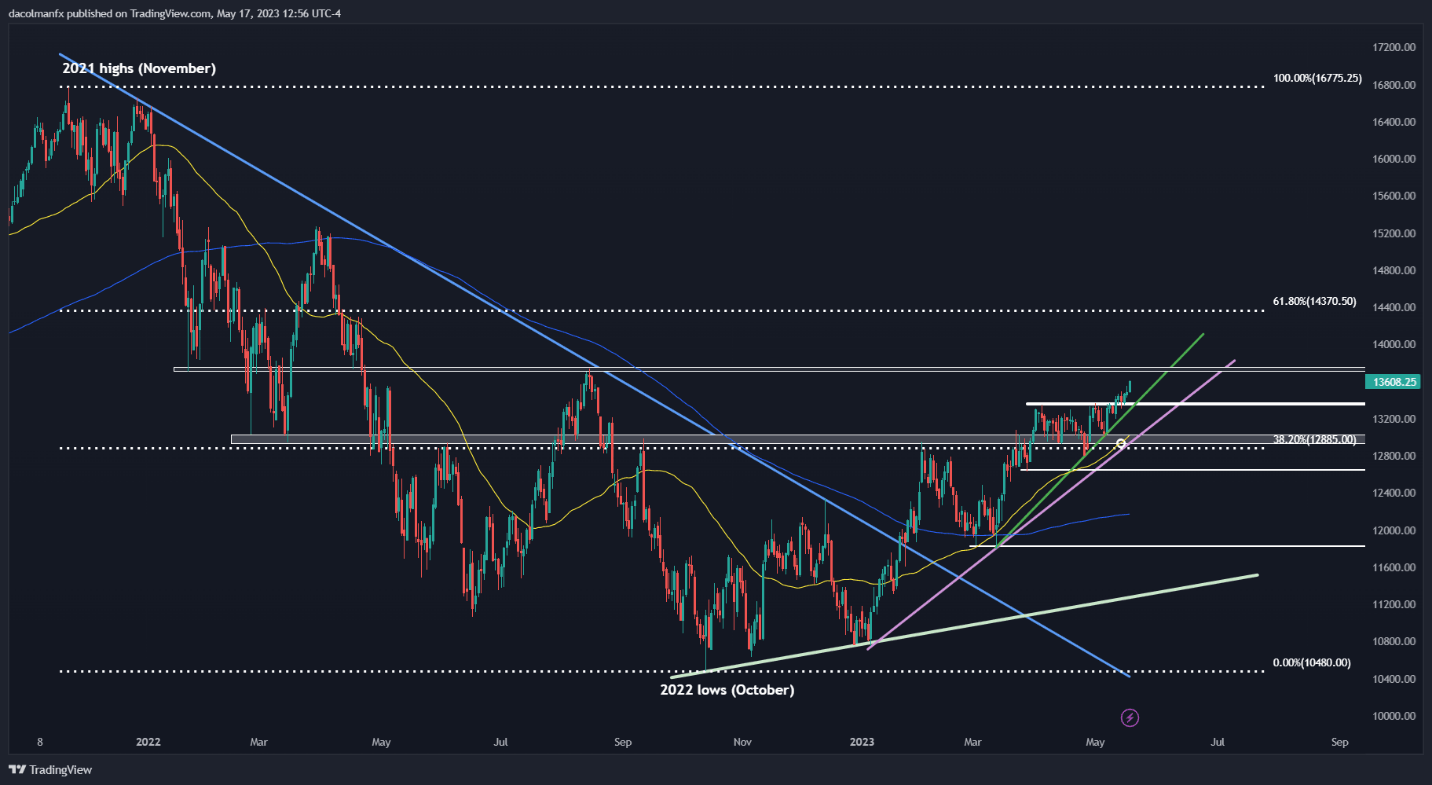
NASDAQ 100 TECHNICAL ANALYSIS
The Nasdaq 100 broke above the important technical resistance at 13,370 last Wednesday, extending its 2023 bull run and setting new highs for the year despite numerous headwinds such as high interest rates, the looming recession, and the likelihood of U.S. default in the face of the stalemate in Congress to raise the debt ceiling.
Although directional moves have been limited in recent sessions, as seen on the daily chart below, the tech index has been able to sustain last week's bullish breakout while slowly pushing higher, signaling buyers have no intention of letting up just yet.
With the Nasdaq 100 on a trajectory of higher highs and lower lows, it may be a matter of time before the bulls manage to successfully launch an attack on 13,740, August 2022 highs. Conversely, if sellers regain control of the market, initial support lies at 13,730, followed by the psychological 13,000 mark.
NASDAQ 100 TECHNICAL CHART