


EUR/USD ANALYSIS TALKING POINTS
- Eurozone PMI data misses reflects declining outlook for the region.
- U.S. PMI data in focus.
- EUR/USD faces key levels.
Trade Smarter - Sign up for the DailyFX Newsletter
Receive timely and compelling market commentary from the DailyFX team
EURO FUNDAMENTAL BACKDROP
The euro opened higher this morning, maintaining its late run last week but ran into some fundamental headwinds post-PMI (see economic calendar below). German PMI was the first blow missing estimates for September, paving the way for a eurozone miss as well. This places the region further into contractionary territory highlighting the economic woes plaguing the manufacturing sector. The fall in EZ PMI’s were seen in both output and new orders while manufactures lowered their orders for inputs to avoid overstocking – S&P Global.
Foundational Trading Knowledge
Macro Fundamentals
Recommended by Warren Venketas
EUR/USD ECONOMIC CALENDAR
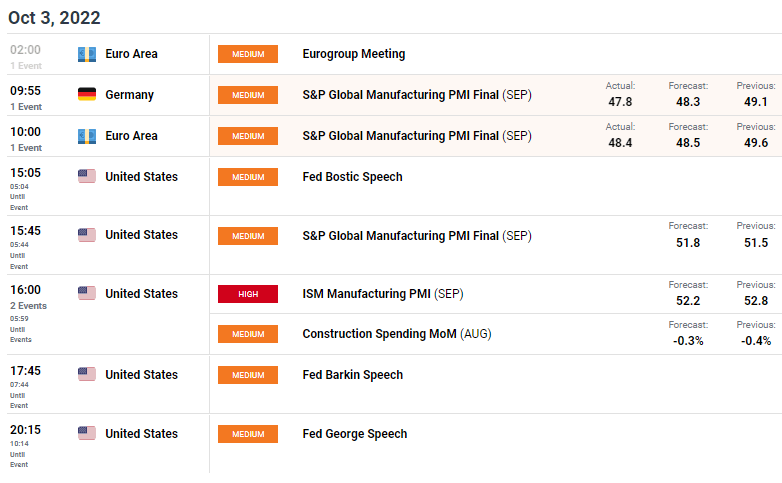
Source: DailyFX economic calendar
Later today, U.S. ISM data is expected lower but within the expansionary zone showing the disparity between the two regions. This is one such example of fundamental divergence that has allowed the Fed’s to maintain its hawkish outlook relative to the ECB.
Limiting the USD this week could be attributed to the spillover effect of FX and bond intervention seen last week which looks likely to continue via the USD/JPY pair which is trading slightly above 145.00 at the time of writing,

TECHNICAL ANALYSIS
EUR/USD DAILY CHART
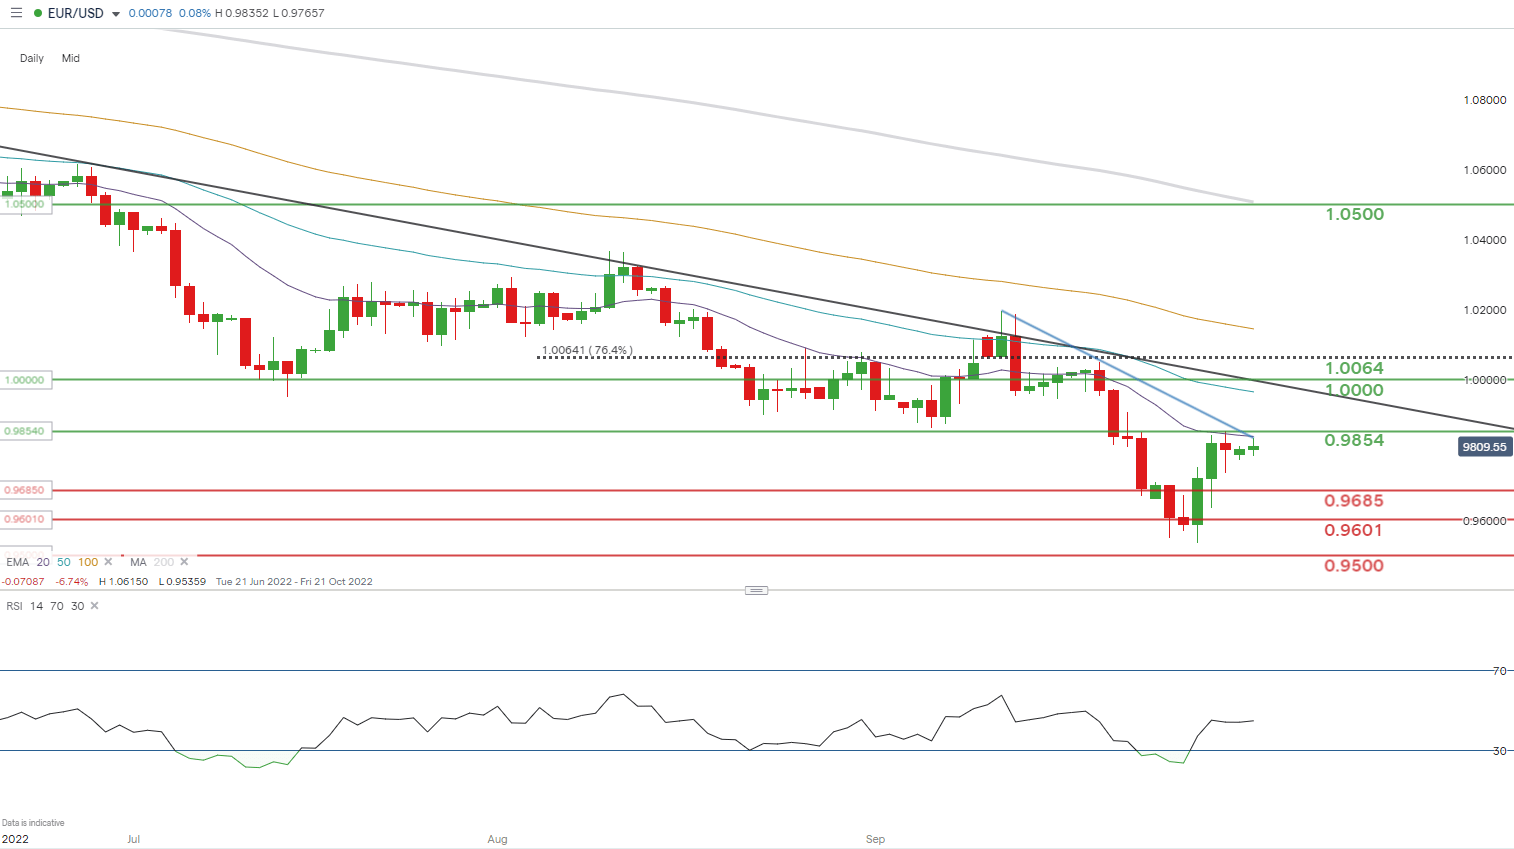
Chart prepared by Warren Venketas, IG
Daily EUR/USD price action is trading at a key area of confluence with the 20-day EMA (purple), short-term trendline resistance (blue) and December 2002 swing low at 0.9854 all converging as resistance. This makes a breakout above this zone significant in that it should open up subsequent upside. With that in mind, fundamentals remain skewed towards USD ascendency making the possibility of a return to 0.9685 more likely.
Resistance levels:
- 50-day EMA (blue)
- 0.9854/2-day EMA/Trendline resistance
Support levels:
- 0.9685
- 0.9601 (September 2002 swing low)
- 0.9500
IG CLIENT SENTIMENT DATA: BULLISH
IGCS shows retail traders are currently LONG on EUR/USD, with 59% of traders currently holding long positions (as of this writing). At DailyFX we typically take a contrarian view to crowd sentiment but due to recent changes in long and short positioning, we favor a short-term upside bias.
| Change in | Longs | Shorts | OI |
| Daily | 4% | 2% | 3% |
| Weekly | -10% | 18% | -2% |
Contact and followWarrenon Twitter:@WVenketas


