


EUR/USD Technical Outlook: Bullish Above 1.0350
- EUR/USD: Bullish continuation potential above 1.0350
- USD Weakness supports Euro/Dollar strength
- Low liquidity continues as US markets close for Thanksgiving

EUR/USD Extends Gains as US Celebrates the Thanksgiving Holiday
EUR/USD bulls are pushing higher after the FOMC meeting minutes revealed the Fed’s intention to decelerate the pace of rate hikes. While monetary policy and recession risks remain the primary drivers of geopolitical risks, a move above 1.0350 suggests that the pair may continue to rise.
As a weaker Dollar and falling yields continues to support Euro appreciation, the absence of US liquidity has resulted in lower trade volume which could contribute to larger than expected price moves.
With the major currency pair on track for its second month of gains, additional buying pressure has driven price action into a significant zone of technical resistance.
Visit DailyFX Education to Discover The Importance of Liquidity in Forex Trading
On the weekly chart below, a firm rebound from the September low and a break of prior trendline resistance drove EUR/USD back above parity 1.000 which remains as longer-term support. The move was then accelerated in the first week of November which drove prices to another key zone at the 2017 low at 1.035.
But, following last week’s attempt to break through 1.045, a rejection of the upper wick and a weekly close at around 1.032 highlighted the importance of this zone.

EUR/USD Weekly Chart
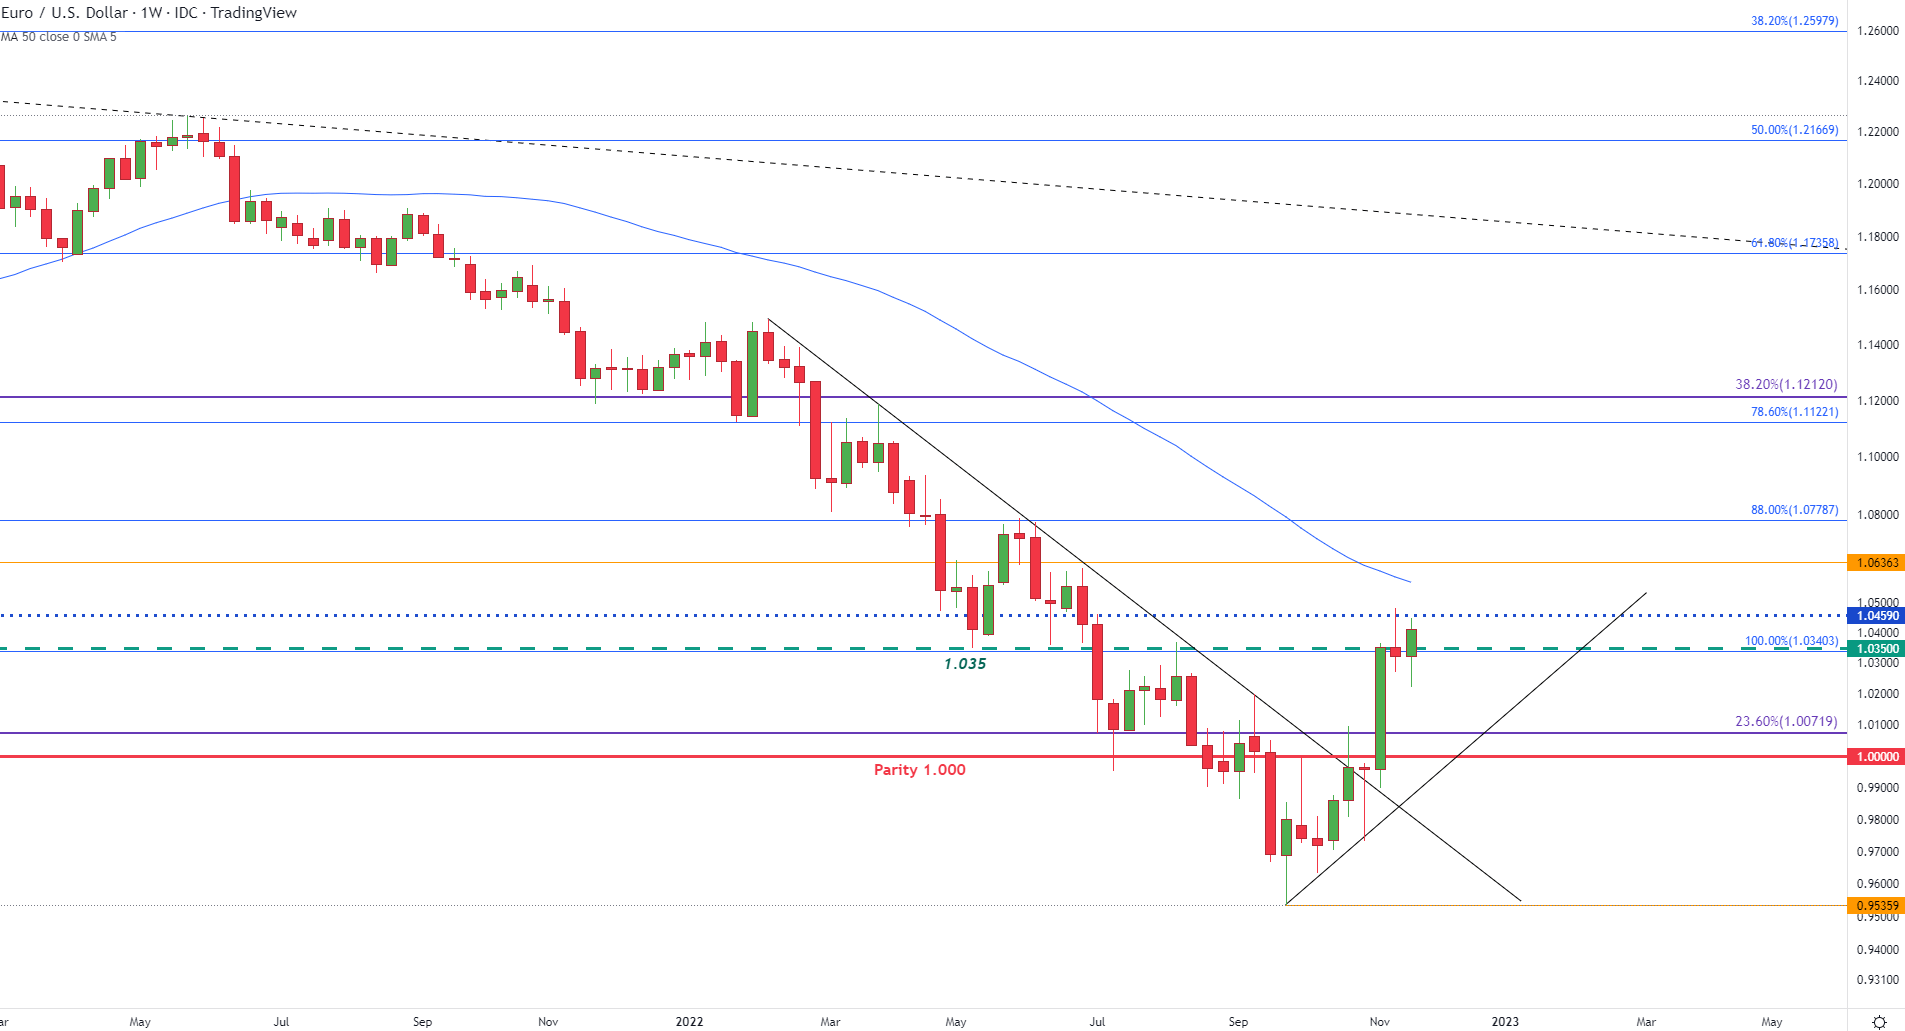
Chart prepared by Tammy Da Costa using TradingView
While the daily timeframe illustrates the pair’s determination to rise back to 1.046, the November high provides additional resistance at 1.048 with a move higher opening the door for the 50-week MA (moving average) at 1.057.
EUR/USD Daily Chart
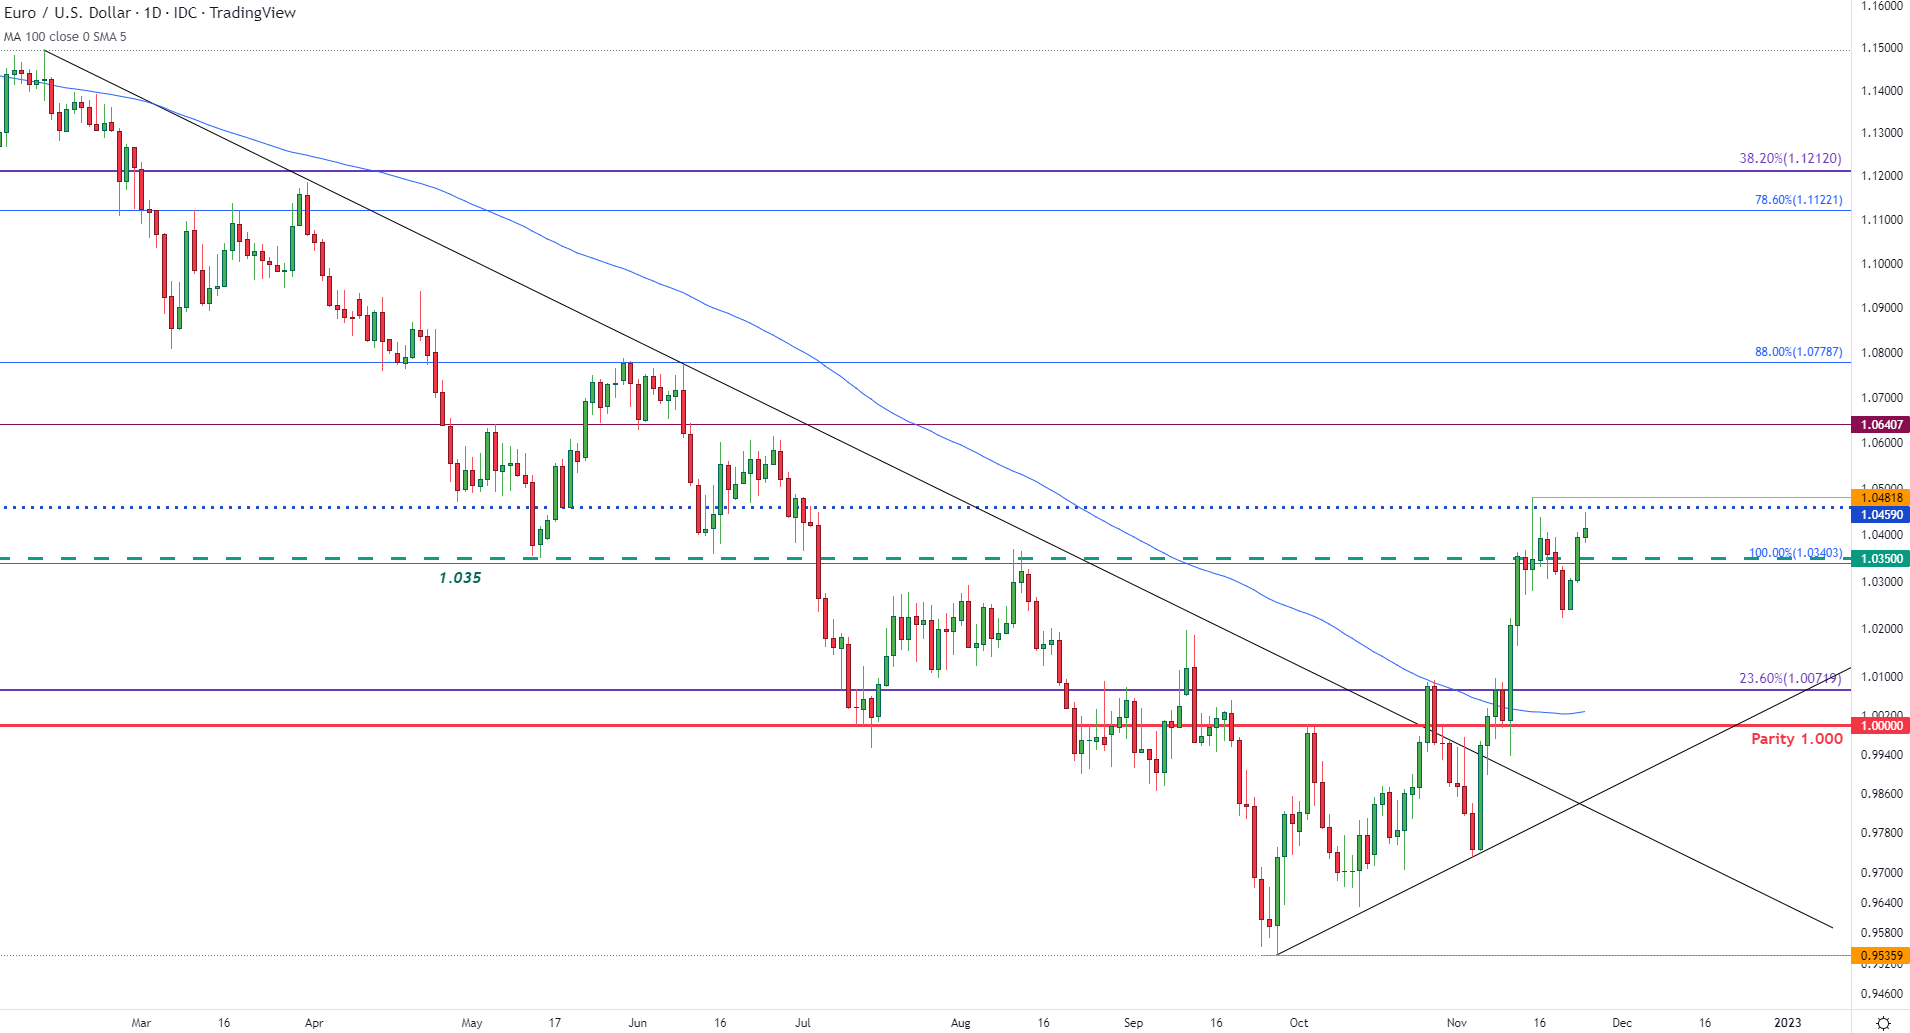
Chart prepared by Tammy Da Costa using TradingView
However, as event risk picks up again next week, Euro depreciation or the renewal of USD strength could drive EUR/USD back towards the weekly open at 1.032 which may bring the weekly low back into play at 1.022.
| Change in | Longs | Shorts | OI |
| Daily | 2% | 0% | 1% |
| Weekly | -10% | 24% | 2% |
--- Written by Tammy Da Costa, Analyst for DailyFX.com
Contact and follow Tammy on Twitter: @Tams707


