


S&P 500, Dollar, EURUSD, GBPUSD and AUDUSD USDJPY, Talking Points:
- The Market Perspective: EURUSD Bearish Below 1.08; USDJPY Bullish Above 133
- A risk aversion lean through Thursday found a fight in the through the Thursday session, but benchmarks are entering Friday trade on the cusp of prominent technical levels
- Where the S&P 500 is leaning against the 2023 bullish trend channel support, the Dollar stands ready to cater to its safe haven status with staging like EURUSD’s balance on 1.0650

We are approaching the weekend and there is the added anticipation surrounding the extended holiday liquidity drain through Monday in US markets. Normally, this would be an occasion for the markets to simply settle into established ranges and allow any short-term premium in implied volatility gauges to simply bleed off. However, it wasn’t so long ago that we witnessed critical technical developments occur just before weekend drains which left the markets to dwell on speculative intent over entire weekends only to pick the thread back up the next week. What is the probability that we are facing yet another one of these outlier events this go around? Typically, I would say that congestion on measures like the S&P 500 (channel and wedge) or Dow Jones Industrial Average (horizontal range and triangle) are readily observed patterns and the VIX still in the lower 10th percentile of its past year’s range is presents a higher probability of the ‘path of least resistance’ outcome. On the other hand, there is some provocative testing on the charts – such as the S&P 500 emini futures slipping the 20-day simple moving average and channel floor pre-Tokyo trade. What’s more, the difference between scenarios carries potentially dramatically different tempos should a charge of fear show up versus a quiet settling into uncomfortable chop in bulls’ favor to end the week.
| Change in | Longs | Shorts | OI |
| Daily | 3% | -6% | -2% |
| Weekly | 18% | -18% | -4% |
Chart of S&P 500 Emini Futures with 20-day SMA, Volume and 1-Day Rate of Change (Daily)
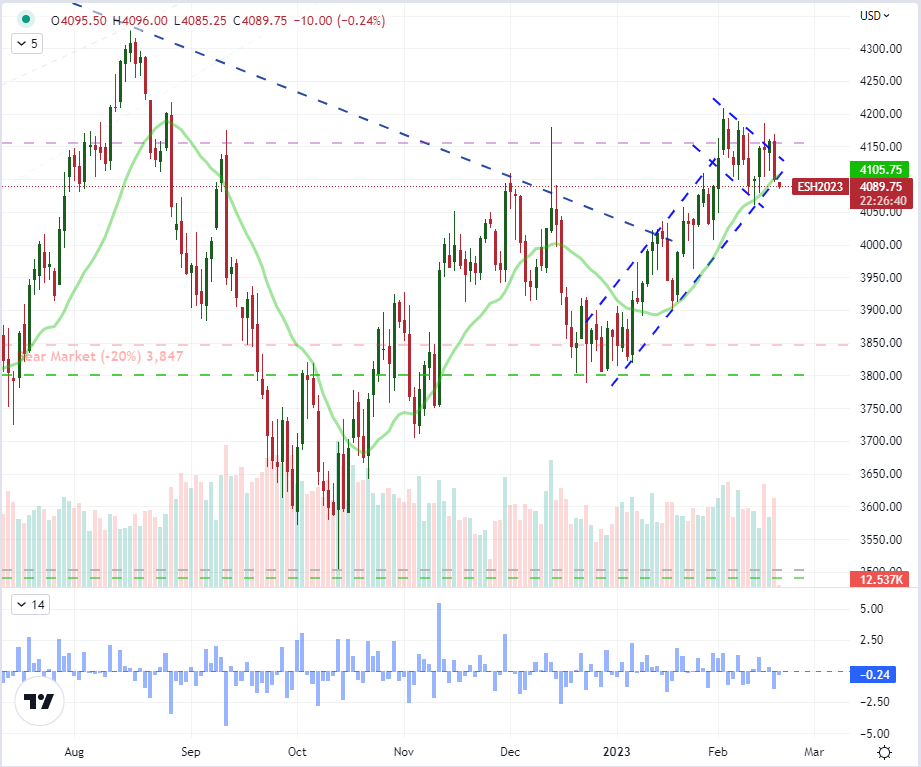
Chart Created on Tradingview Platform
While many traders have their favorite ‘risk asset’ there tends to be far less interest in go-to safe havens. In a world that seems to promote ‘long only’ perspective with shares trading representing the most common market exposure for investors over the past century, that isn’t too surprising. However, the market movements in a ‘risk off’ scenario are far more aggressive than the typical advance. While there are assets like gold, Treasuries, money markets and others that are referenced in textbooks; the Dollar is perhaps my preferred haven asset of the moment given its ultimate liquidity and its greater current sensitivity to downdrafts in speculative assets. We’ve seen the recent swell in the DXY Dollar Index has drawn more from the fresh lift given to Fed rate expectations, but the upside on the market’s hawkish view will likely be very restricted going forward with large gaps between official updates. Alternatively, sentiment is flippant and can explode ‘out of the blue’. Should the S&P 500 bite on its tentative break during Friday exchange hours, it will likely in turn charge the VIX and give a more capable push for the Greenback.
Chart of DXY Dollar Index Overlaid with Implied Fed Funds Aug 2023 Rate, 20 and 60-Day Correl (Daily)
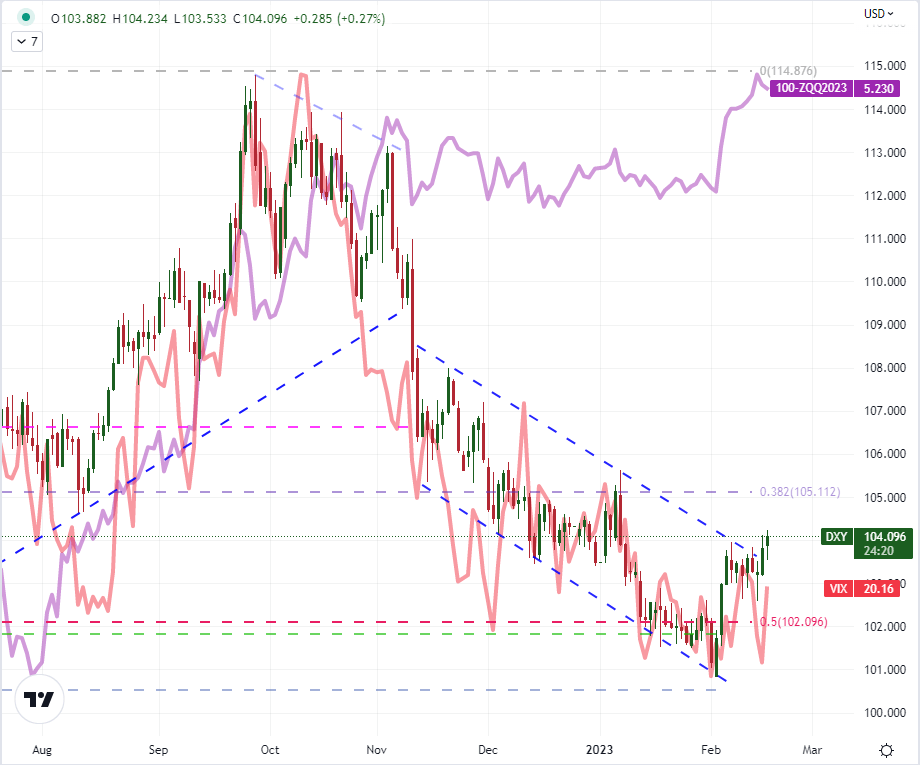
Chart Created on Tradingview Platform
The DXY Index can be a good reference for the currency’s health, but it isn’t what most active FX traders are monitoring for making their calls on momentum. USDJPY has been of greater interest to me for this reason, and the break above 133 earlier this week was noteworthy, but a single pair – even a liquid one such as this – will not define the Dollar overall. Yet, if we see more of the ‘majors’ conform to a broader USD bid; the potential for a productive follow through will rise substantially. First and foremost, my attention is on EURUSD. The most liquid currency pair in the world bar none, we have a series of lower lows that has kept the pressure on the lower bound (roughly 1.0650) of the past two weeks. There is more technical support below this (a cluster of Fibs), but more breaks could see more capable momentum.
Chart of EURUSD with 20 and 100-Day SMAs, 10-Day Historical Range (Daily)
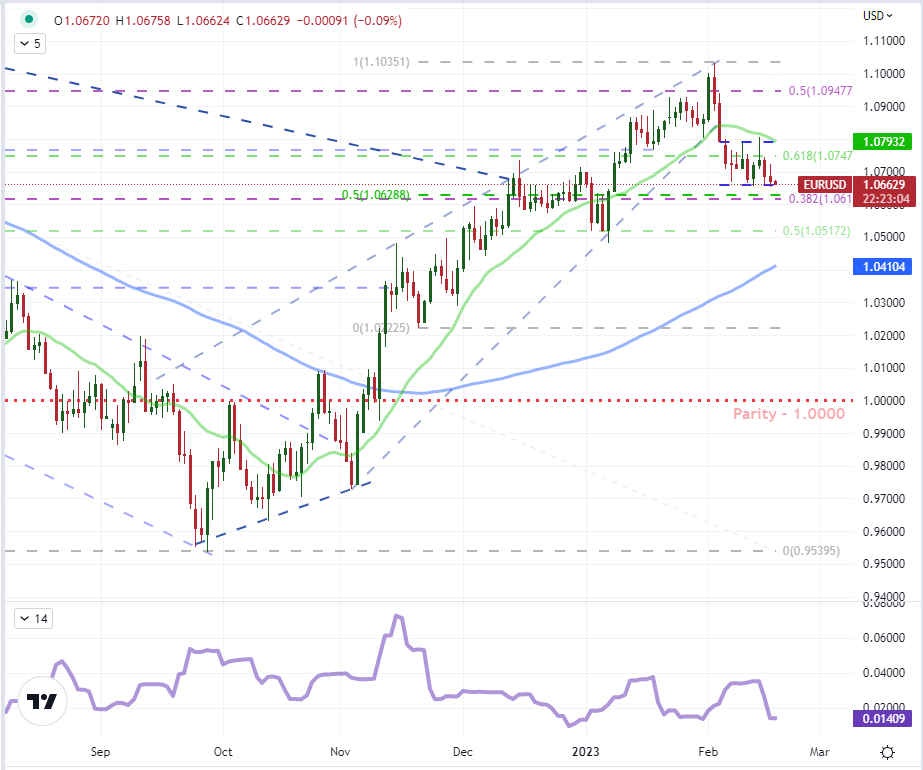
Chart Created on Tradingview Platform
In a similar position to EURUSD, GBPUSD is entering Friday threatening a break of three-month rising triangle’s support. My trendline was at 1.2000, but the specific technical ray matters less than the build up of traction towards more bearish progress. It was remarkable that the added pressure of the UK inflation earlier this week – which sent many other Sterling crosses into significant movement – was curbed for the Sterling. If we take out the February low here and then move on to the 100-day SMA, it could generate a lot of heat in the broader view of the Dollar.
Chart of GBPUSD with 20 and 100-Day SMAs (Daily)
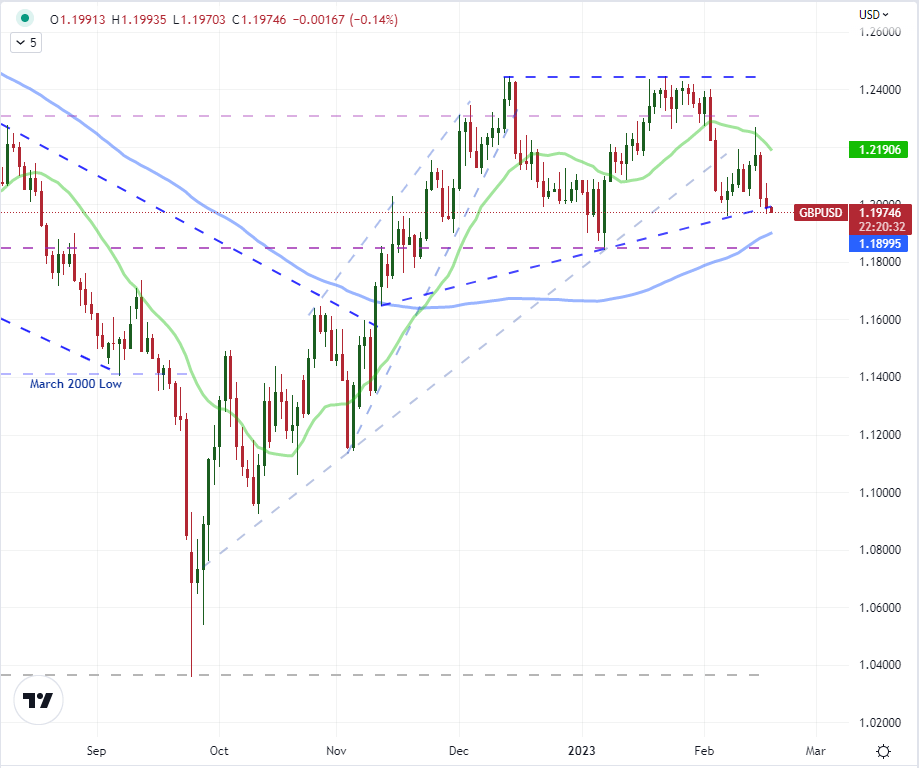
Chart Created on Tradingview Platform
Much further down on the Bank for International Settlements’ (BIS) liquidity scale to EURUSD, USDJPY and GBPUSD is AUDUSD. This is not the type of cross that would singlehandedly motivate a commitment from the world’s largest currency. Yet, I’m not looking for a leader in this instance because conditions are not simply looking for a fundamental or technical catalyst. What we are seeking is breadth in the Dollar’s move to overcome a liquidity restriction. As such, a break of the head-and-shoulders pattern here would add considerable weight to a productive Dollar end to the week.
Chart of AUDUSD with 20, 50 and 100-Day SMAs (Daily)
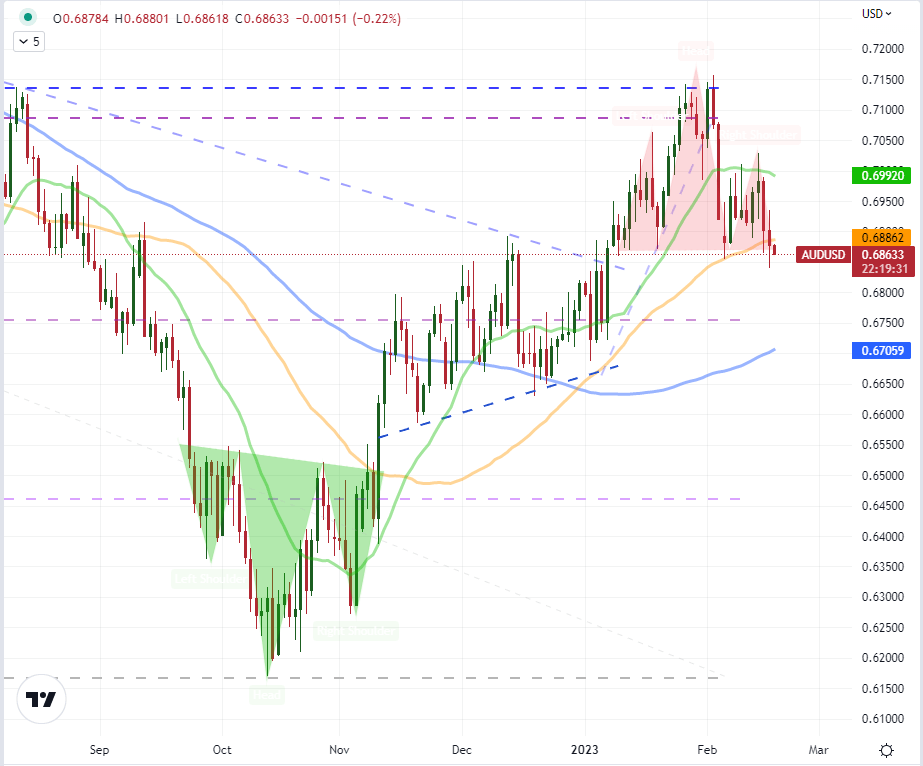
Chart Created on Tradingview Platform
For event risk, I believe that any volatility from the market would come first and the listings we have Friday would be used as justification after the fact – this is why its important not to commit to the dogma of any one single analysis type. Nevertheless, I think US import inflation could speak to monetary policy while the Conference Board’s leading index has stood out as a ‘recession’ signal recently. The Pound will also have UK retail sales while the Loonie will pick up on upstream inflation. Then there is also the options expiration which can frequently cause distortion in ‘the roll’.
Top Global Macro Economic Event Risk for Friday and Next Week
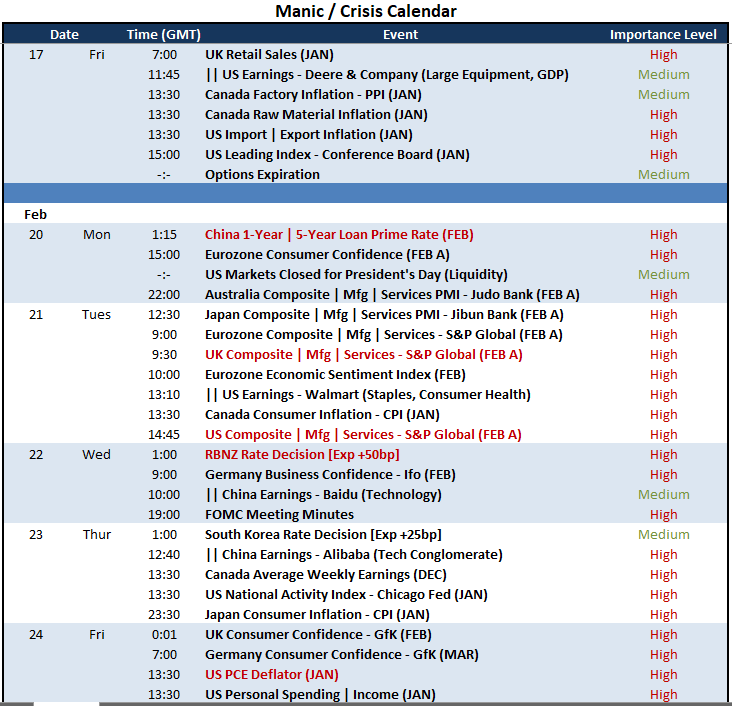
Calendar Created by John Kicklighter
Trade Smarter - Sign up for the DailyFX Newsletter
Receive timely and compelling market commentary from the DailyFX team


