


Dollar, EURUSD, USDJPY, Dow, Volatility and Fed Talking Points:
- The Market Perspective: EURUSD Bearish Below 1.08; Dow Range Between 34,200 and 33,200; USDJPY Bullish Above 133
- Despite a let up in the charge higher for US interest rate forecasts and a non-committal backdrop on risk trends, the DXY Dollar Index earned a notable technical break
- Standing at the verge of a well-trodden technical congestion, the Dow defaulted to the ‘path of least resistance’ pulling back into range – will volatility readings at extremes continue to settle?

There were two speeds among the dominant market measures I tend to monitor on the global macro spectrum. For much of the market, there was reticence that would fold before major technical boundaries were truly tested. And for a small segment of the financial spectrum, there were some action-oriented breaks. The most prominent technical development on my radar was from the US Dollar. The DXY Dollar Index advanced a fairly modest 0.6 percent Wednesday, but that progress would come at the expense of the descending trend channel resistance that has developed since the high on November 11th (the day after the pivotal October CPI release) was put into place. The break from the past six-day horizontal congestion was a little more ambiguous for conviction however. Amongst the ‘majors’ (the most liquid Dollar-based pairs), USDJPY earned its ‘break’ credentials in a 104 pip rally that decisively cleared the 103.00 level founded on a five-week range high and the 38.2 percent Fibonacci retracement of the 2021 to 2022 bull run. As appealing as that picture may be, the trouble starts to arise when we attempt to trace back a fundamental motivation and realize that other majors have yet to second the move for the Greenback.
Chart of DXY Dollar Index Overlaid with Implied Fed Funds Aug 2023 Rate, 20 and 60-Day Correl (Daily)
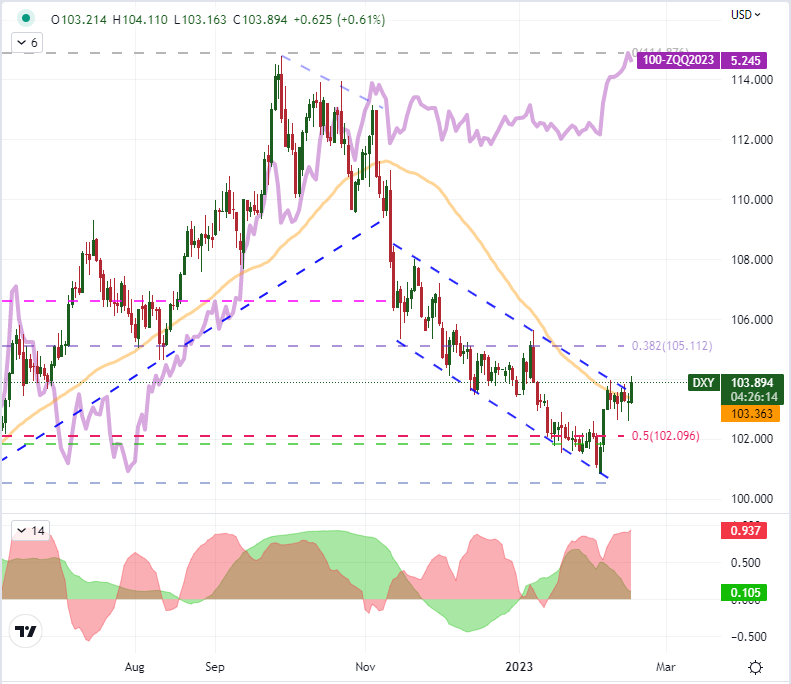
Chart Created on Tradingview Platform
There are a few major fundamental motivation from which the Dollar tends to draw on when generating volatility and trend. Its safe haven status is arguably the most potent driver, but volatility was notable very benign this past session. Alternatively, we have the monetary policy differentials which have been a frequent driver of the FX market over the past year. Here, we have seen a significant build up in US-based rate forecasts these past few weeks first after the NFPs earlier in the month and the slower-than-expected deceleration in CPI this week. That said, the charge in Fed Fund futures implied rates was significant yesterday when the Dollar was landlocked and the jump occurred Wednesday as that pressure ebbed. Looking to other Dollar-based pairs, it seems that USDJPY may be an outlier at the moment – and scenario probabilities tend to favor the majority. A more common picture for the Dollar can be drawn from EURUSD. The world’s most liquid currency pair was lower – in favor of the Dollar – this past session, but it still fell neatly within its 8-day range between 1.0800 and 1.0650. Should this pair mark a break, it could significantly alter the calculus; but holding the lines will exact a strong influence over the benchmark currency.

Chart of EURUSD with 20-Day SMA and 8-Day Historical Range (Daily)
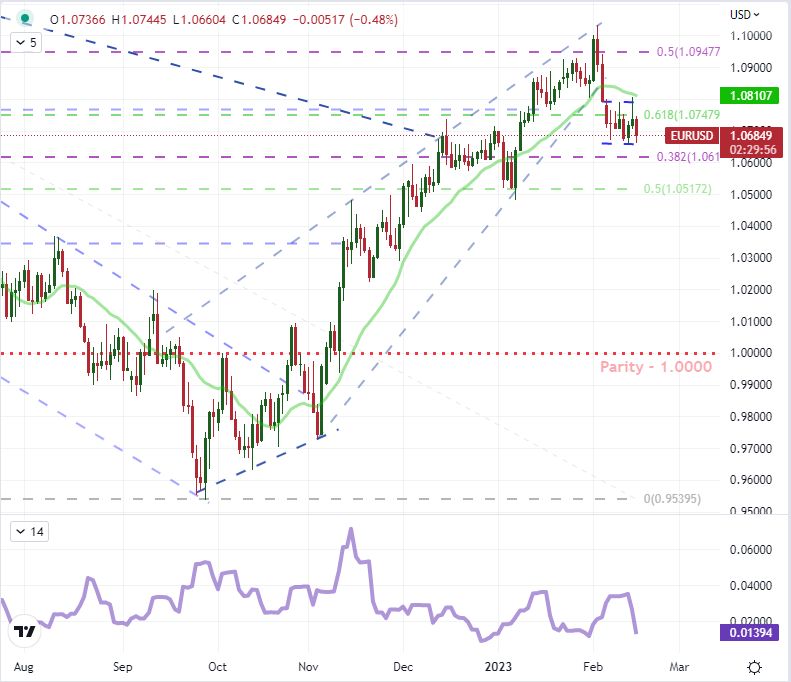
Chart Created on Tradingview Platform
Between the Dollar and the Dow as a model for market tempo, I would have to say that the US equity index seems to better reflect the backdrop. The ‘blue chip’s’ inside day (whereby the range of Wednesday fit neatly within Tuesday’s as a sign of indecision) summed up the picture nicely. There is a much larger congestion pattern that this index has committed to built out of a wedge with the 50-day simple moving average and midpoint of the past three months’ range as support. This has in turn helped build out a 14-day historical range that is the most restrictive trading for the benchmark since September 9, 2021 – before the market made its first notable bearish break of the post-pandemic bull run. A resolution will come eventually, but conviction is necessary for providing real traction for trend development. In the meantime, volatility measures for equities, Treasuries, FX, oil, gold and emerging markets have all noticeably deflated.
| Change in | Longs | Shorts | OI |
| Daily | -9% | -5% | -7% |
| Weekly | 7% | -9% | -2% |
Chart of Dow with 50-Day SMA and 14-Day Historical Range (Daily)
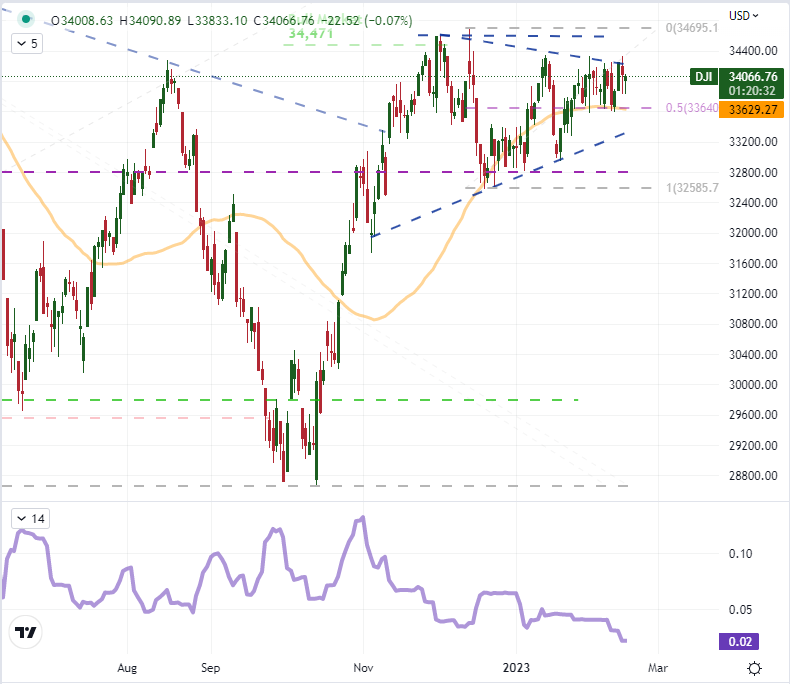
Chart Created on Tradingview Platform
The best remedy for aimless and quiet markets is an acute fundamental spark that can tip a deeper fundamental theme that in turn sets a blaze on speculative conviction – bullish or bearish. Unfortunately, what we have on the docket through the end of the week is not the kind of event risk that I would expect to seriously charge a major regional market or asset class – much less the global macro landscape. While I will take in some modest earnings event risk, the Australia employment data, Chinese housing inflation and UK retail sales; it is the Fed speak that seems to carry the most potential for me. While upstream US inflation (PPI and import) is noteworthy and housing data an important economic conduit at the moment, the central banker rhetoric could tip the scales on rate expectations following the CPI release earlier this week. It is a high bar to truly charge the market, but it is perhaps the most capable ‘known’ update on tap.
Top Global Macro Economic Event Risk for the Next 48 Hours
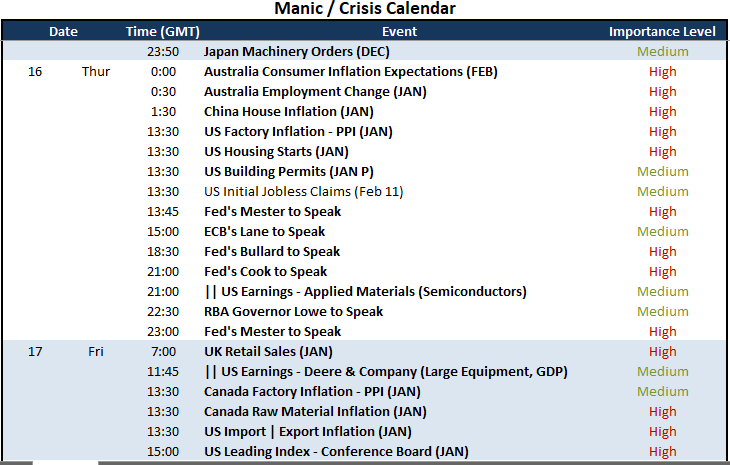
Calendar Created by John Kicklighter


