


FTSE 100, DAX 40, Wall Street 30 Overview:
- FTSE 100 price action remains in a tight range despite rising recession risks
- DAX 40 futures slide to another zone of psychological support after eight weeks of gains
- Dow Jones tests prior resistance turned support ahead of a big week of economic data

Risk Aversion Returns to Markets as Protests in China Make Headlines
Major stock indices are trading lower after protests in China reduced demand for risk assets. With Dax, FTSE and DJIA facing fundamental and technical headwinds, a surge in volatility could drive price action for the remainder of the week.
As the eight-week Dax 40 rally eases back from the 14500 psychological level, the 23.6% Fibonacci retracement of the 2020 – 2021 is holding as support at 14330. While the weekly chart illustrates a slowdown in bullish momentum, the 61.8% retracement of the 2022 move provides additional resistance at 14576.
Dax 40 Weekly Chart
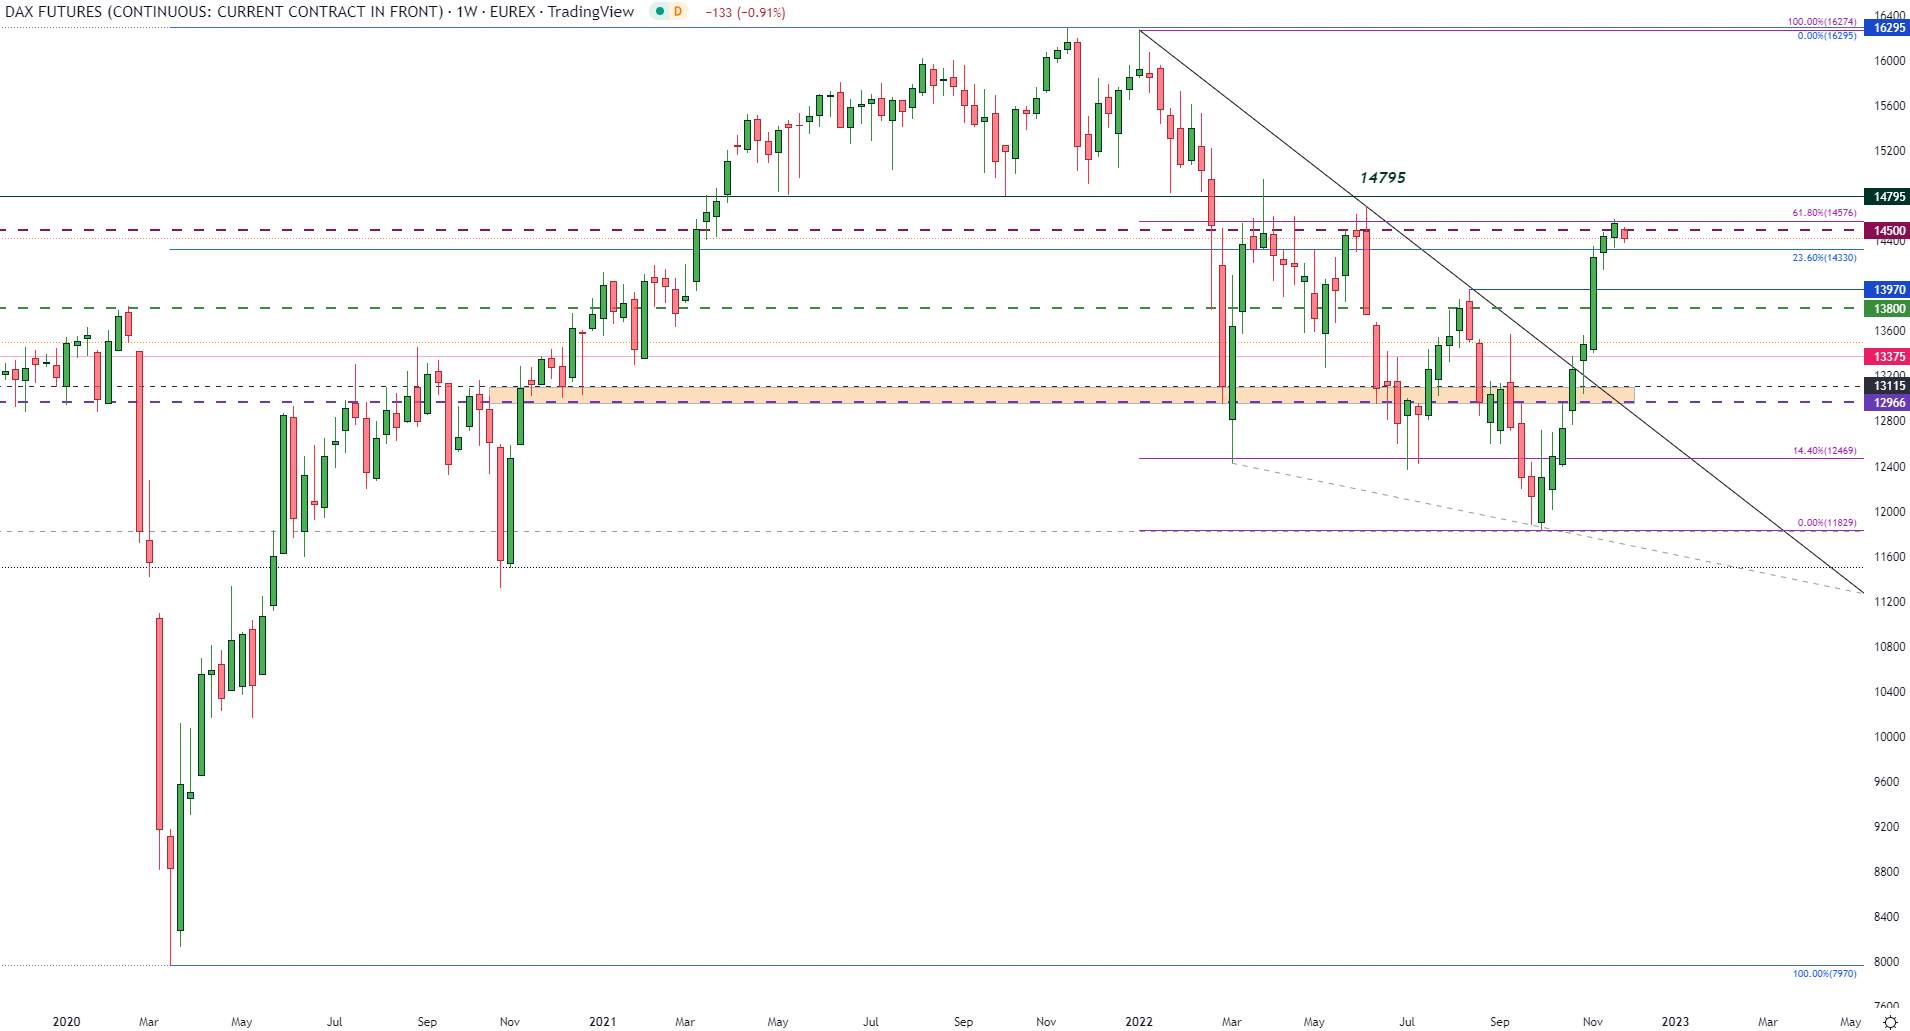
Chart prepared by Tammy Da Costa using TradingView

From a shorter timeframe, the daily chart shows a doji candle forming between 14500 and 14576, highlighting indecision. But, with US liquidity returning to markets, a current 0.78% daily decline has pushed Dax 40 back to prior historical resistance turned support at 14400.
Dax Daily Chart
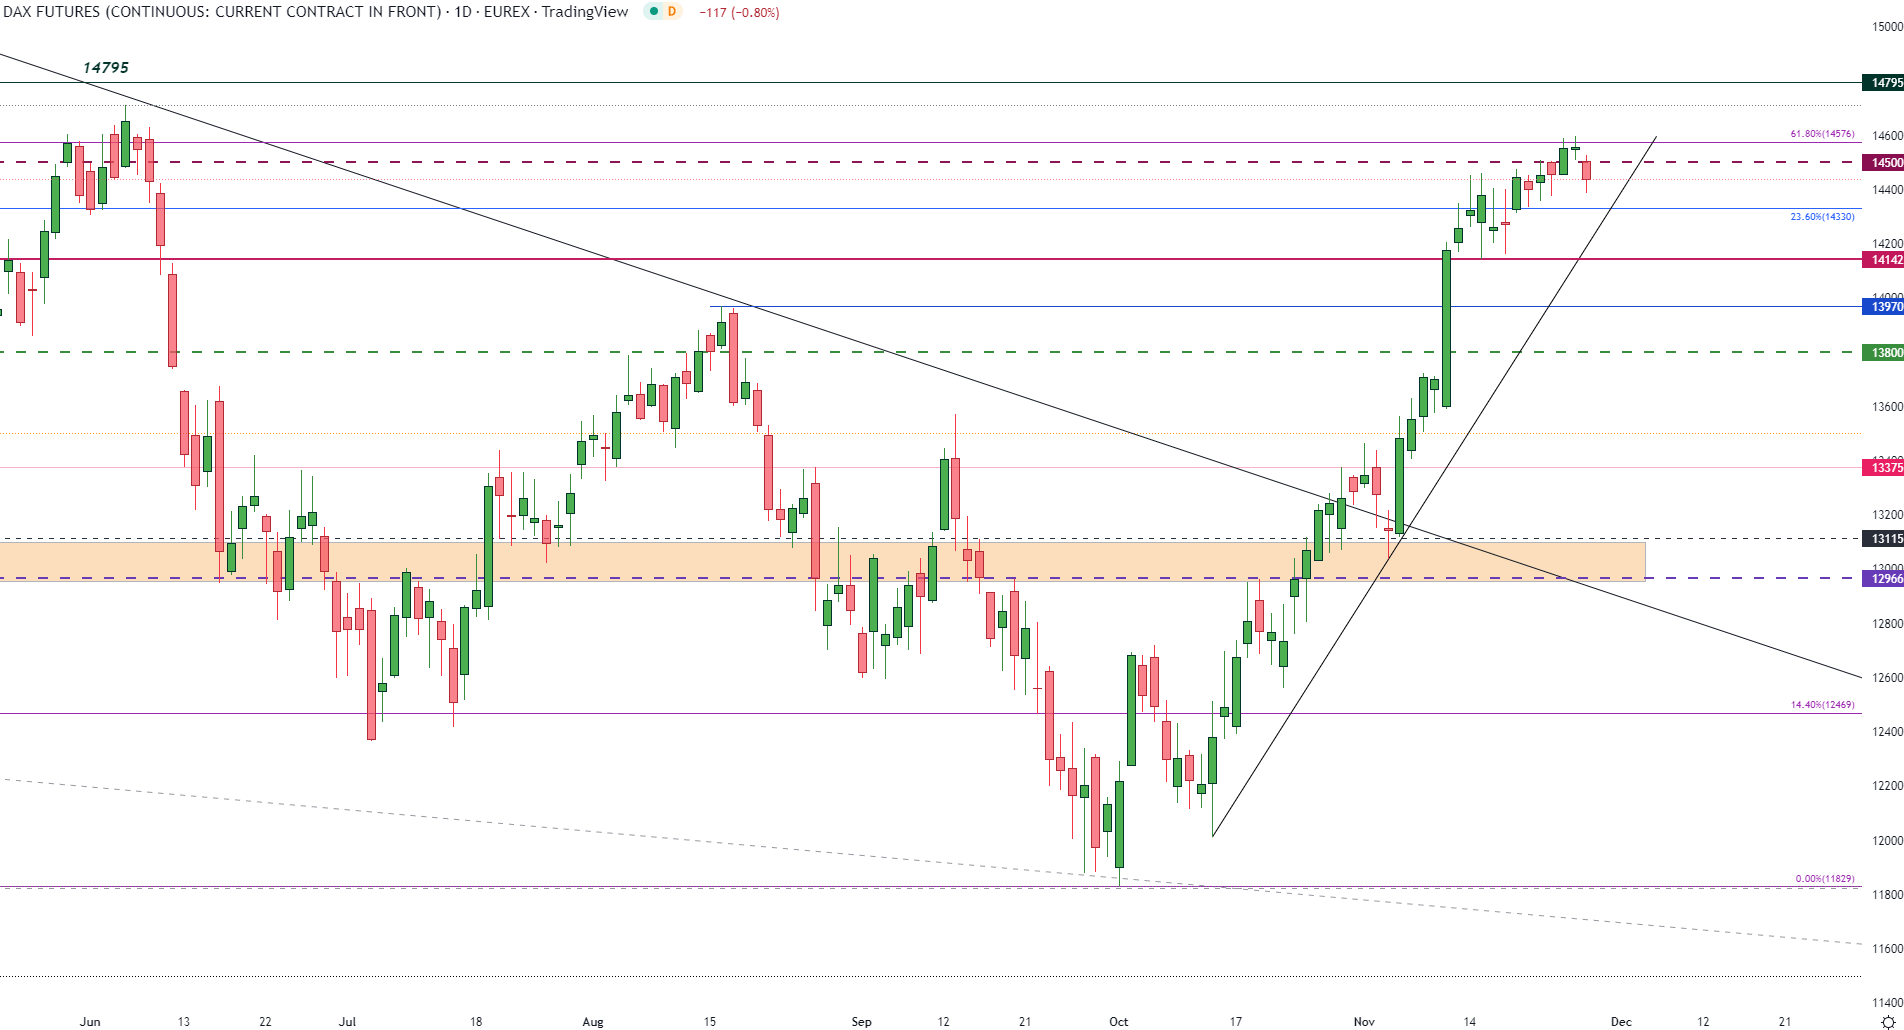
Chart prepared by Tammy Da Costa using TradingView
FTSE Technical Analysis
For the FTSE 100, prices have remained in a tight range throughout the day as prices trade between 7486 and 7490. With the rising trendline forming support at 7420, the 7400 and 7346 have provided historical support and resistance and may continue to do so in the short-term.
FTSE Daily Chart
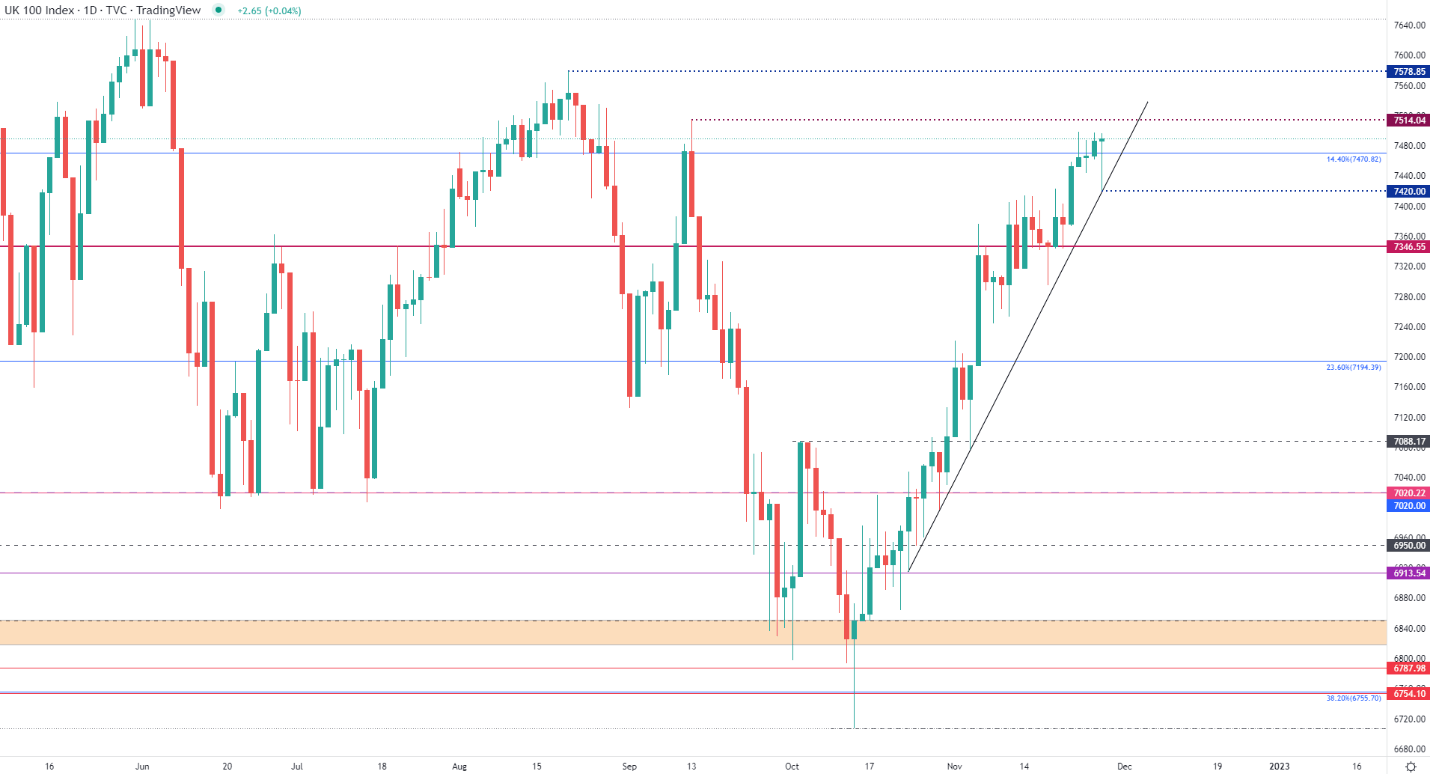
Chart prepared by Tammy Da Costa using TradingView
As recession fears and higher rates threatening growth forecasts, focus has shifted back to the economic calendar. With central banks focused on restoring price stabilities, the Federal Reserve is expected to keep a close eye on this week’s economic releases.
While Dow futures follow Dax in shedding approximately 0.79% for the day, GDP, Core PCE, NFP’s (non-farm payrolls) and developments in China are factors that could threaten the trajectory for equities this week.
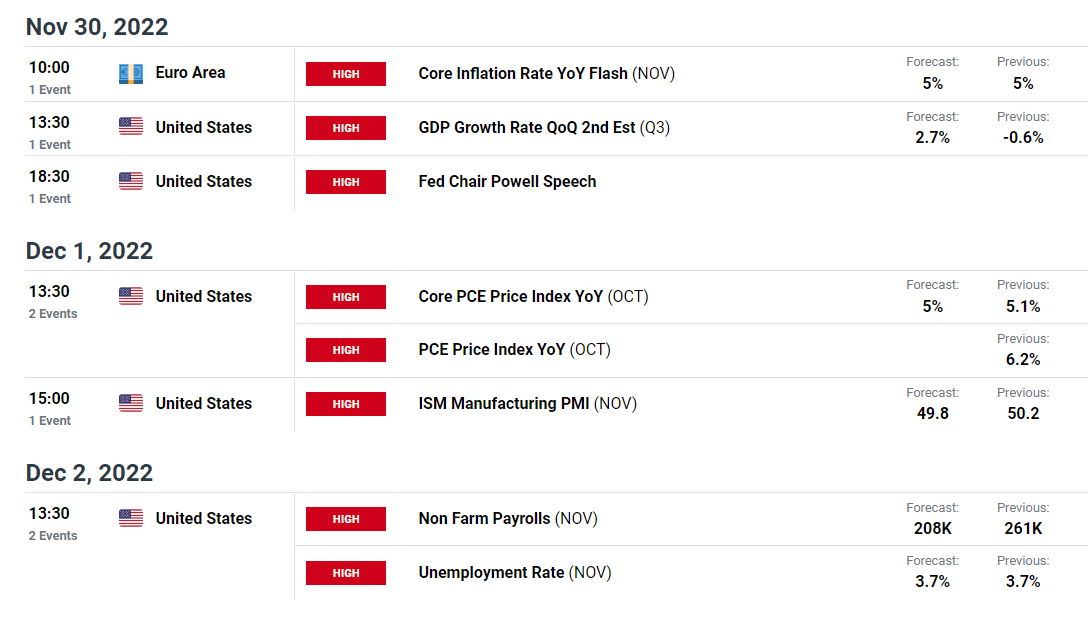
DailyFX Economic Calendar
--- Written by Tammy Da Costa, Analyst for DailyFX.com
Contact and follow Tammy on Twitter: @Tams707


