


Crude Oil, WTI, Brent, SPR, China, US Dollar, Federal Reserve, TOPIX - Talking Points
- Crude oil has staged a comeback this week with the help of reserve buying
- Chinese data continues to underwhelm as concerns grow for its economic health
- The US debt ceiling is grabbing the headlines. How long will the deadlock remain?
Trade Smarter - Sign up for the DailyFX Newsletter
Receive timely and compelling market commentary from the DailyFX team
Crude oil nudged slightly higher on Tuesday after notable gains in the North American session after it was announced 3 million barrels will be bought to replenish the depleted supplies at the Special Petroleum Reserve (SPR).
The WTI futures contract is near US$ 71.50 bbl while the Brent contract is a touch above US$ 75.50 bbl.
The rally was little impeded despite soft Chinese data revealing that the reopening from Covid-19 restrictions is yet to deliver the economic expansion that the government and the market had been hoping for.
Chinese industrial production came in at 5.6% year-over-year to the end of April against the 10.9% anticipated and 3.9% prior.
Retail sales for the same period were 18.4%, instead of the 21.9% forecast and 10.6% previously.
Fixed asset investment ex-rural and property investment also missed estimates printing at 4.7% and -6.2% respectively. There was a strong base effect across the data due to the economy being in Covid-19 lockdown restrictions at this time last year.
In the North American session, three Fed speakers gave three different perspectives. The relatively newly appointed Chicago Fed President Austan Goolsbee sounded a slightly dovish note when he said that he wasn’t keen on the last hike by the Fed.
Atlanta Federal Reserve President Raphael Bostic said that if he had to vote today, he would not change rates while Minneapolis Federal Reserve President Neel Kashkari believes that the Fed still has more work to do to bring down inflation.
In any case, Treasury yields were mostly unchanged through the short end of the curve but 10 years and beyond added less than a handful of basis points. Despite this, the US Dollar has given up some ground.
Similarly, equity markets were little fazed by the commentary, but the spotlight appears to be firmly focused on the debt ceiling issue.
House Speaker Kevin McCarthy has said that a deal is still some way off while Treasury Secretary continues to highlight the impending deadline of June 1st before the unthinkable of a US default becomes a possibility.
Amongst the uncertainty, gold continues to be seen as a potential haven, trading above US$ 2,010 an ounce. Japan’s TOPIX equity index traded at its highest level since 1990 but the rest of APAC equity indices were mixed without any major moves.
After UK jobs data and EU GDP figures, the US will see retail sales numbers and Canada will get the latest CPI readings.
The full economic calendar can be viewed here.

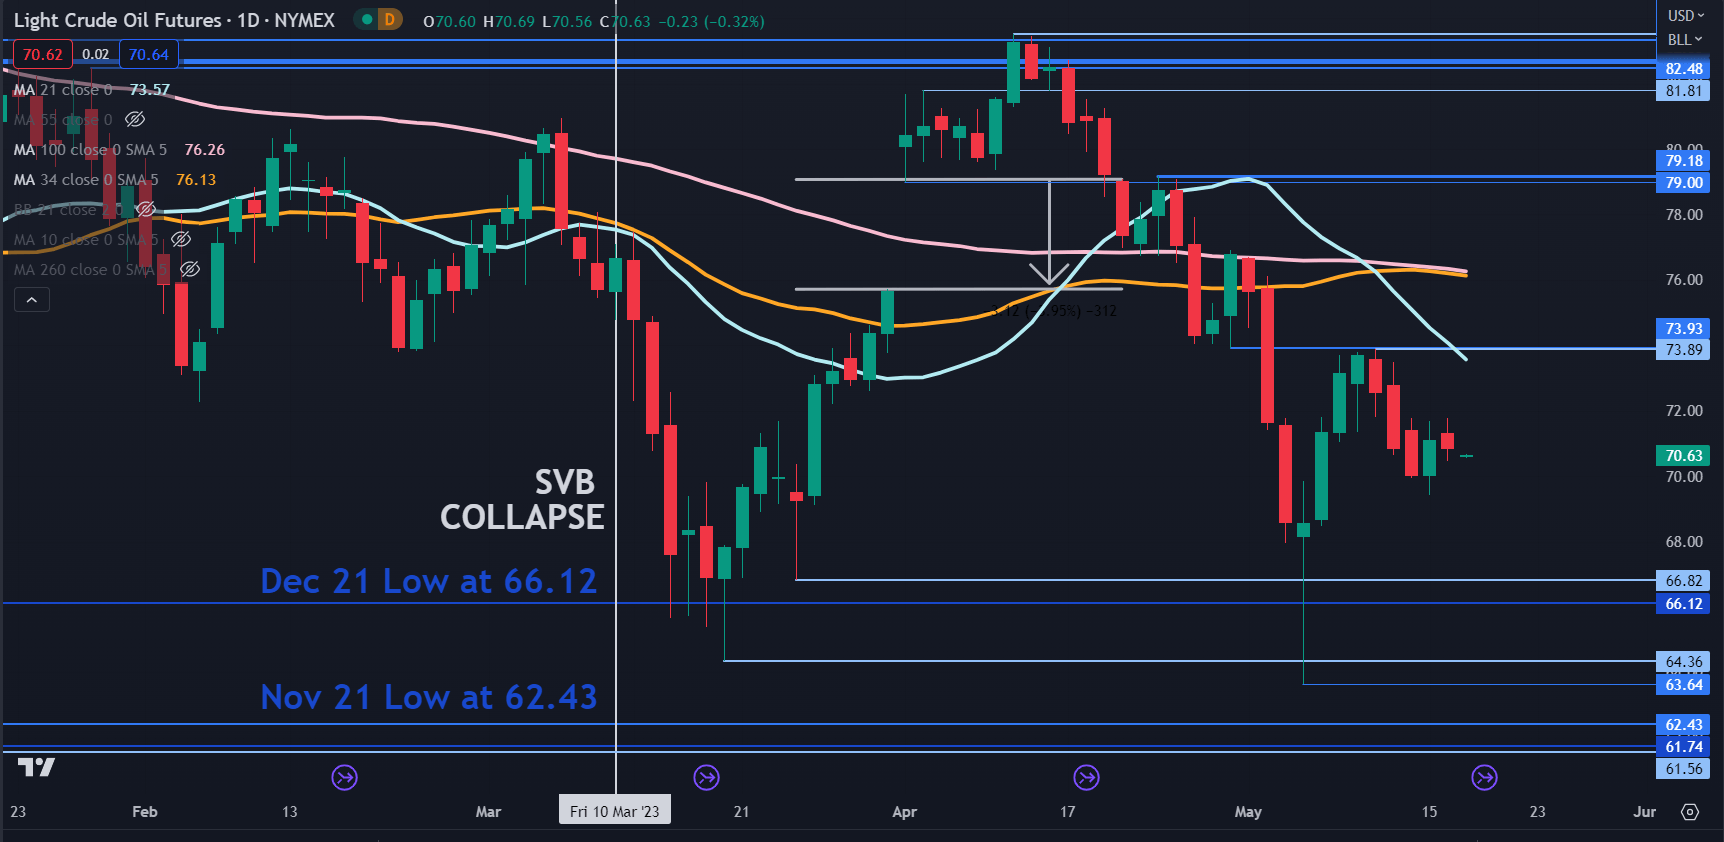
WTI CRUDE OIL TECHNICAL ANALYSIS
WTI appears to be consolidating back in the range again after scoping out another run lower last week.
Resistance could be at the breakpoint of 73.93 which is just above the recent peak at 73.89. The 21-day Simple Moving Average (SMA) is just above these levels and may lend resistance. Further up, the 34- and 100-day SMAs might offer resistance, currently near 76.35.
On the downside, support might reside at the breakpoints of 66.82, 66.12 and 64.36 or further below at the prior lows of 63.64 and 62.43.
--- Written by Daniel McCarthy, Strategist for DailyFX.com
Please contact Daniel via @DanMcCarthyFX on Twitter


