
British Pound Q2 2023 Technical Forecast:

The British Pound's technical outlook is neutral with the UK currency likely to be relatively stable to marginally firmer over the coming weeks. And that means we need to look at the dynamics of other major currencies to see if there are any potentially attractive set-ups against Sterling. Two currencies spring to mind, the US dollar and the Euro.
Both the US Federal Reserve and the Bank of England have hiked rates over the last year, keeping the interest rate differential between the two currencies roughly equal. Going forward this may change with the Fed likely to pause before starting to cut rates later this year while the BoE may have another hike before they pause. While the rate differential between the two currencies may not widen dramatically, sentiment may underpin GBP/USD.
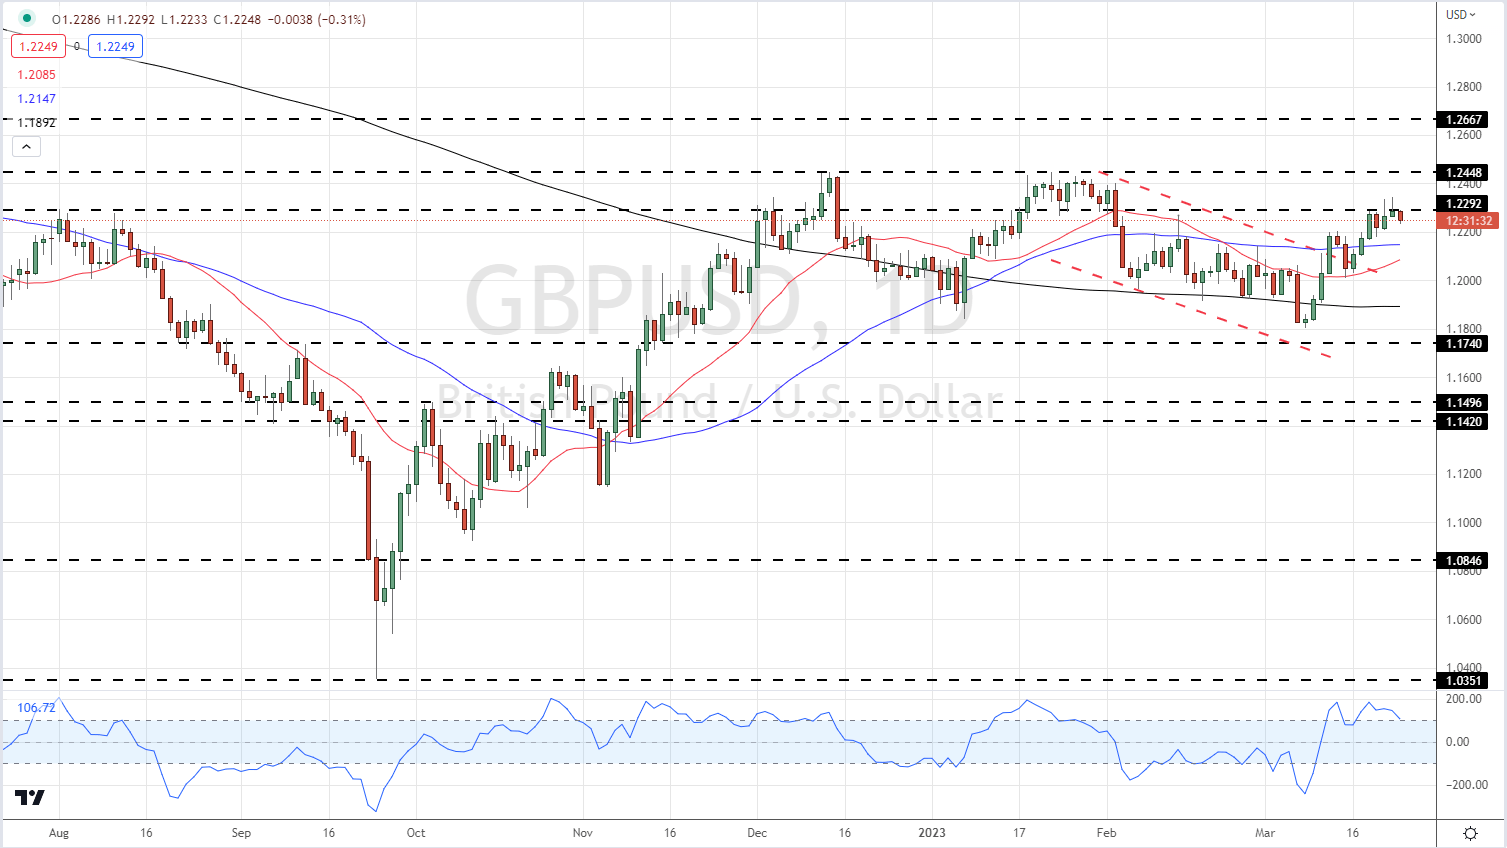
The daily GBP/USD chart shows how the pair has traded sideways over the past three months with cable currently eyeing the resistance at 1.2448. The moving average set-up is positive and should continue to underpin the move higher, while the recent series of higher lows indicate ongoing strength in the pair. If the pair breaks and opens above resistance at 1.2448, then a prior high at 1.2667 comes into play. Looking ahead, GBP/USD in Q2 may continue its sideways trade with a slight upside bias.
GBP/USD Daily Price Chart
While Sterling may push higher against the US dollar, it is likely to struggle against the Euro, again on rate differential expectations. The European Central Bank has been very vocal about the need to continue hiking interest rates over the next few months in its ongoing battle against inflation and this will lead to the interest rate differential against the British Pound widening, favoring the Euro.
| Change in | Longs | Shorts | OI |
| Daily | 14% | -24% | -9% |
| Weekly | -37% | 43% | -12% |
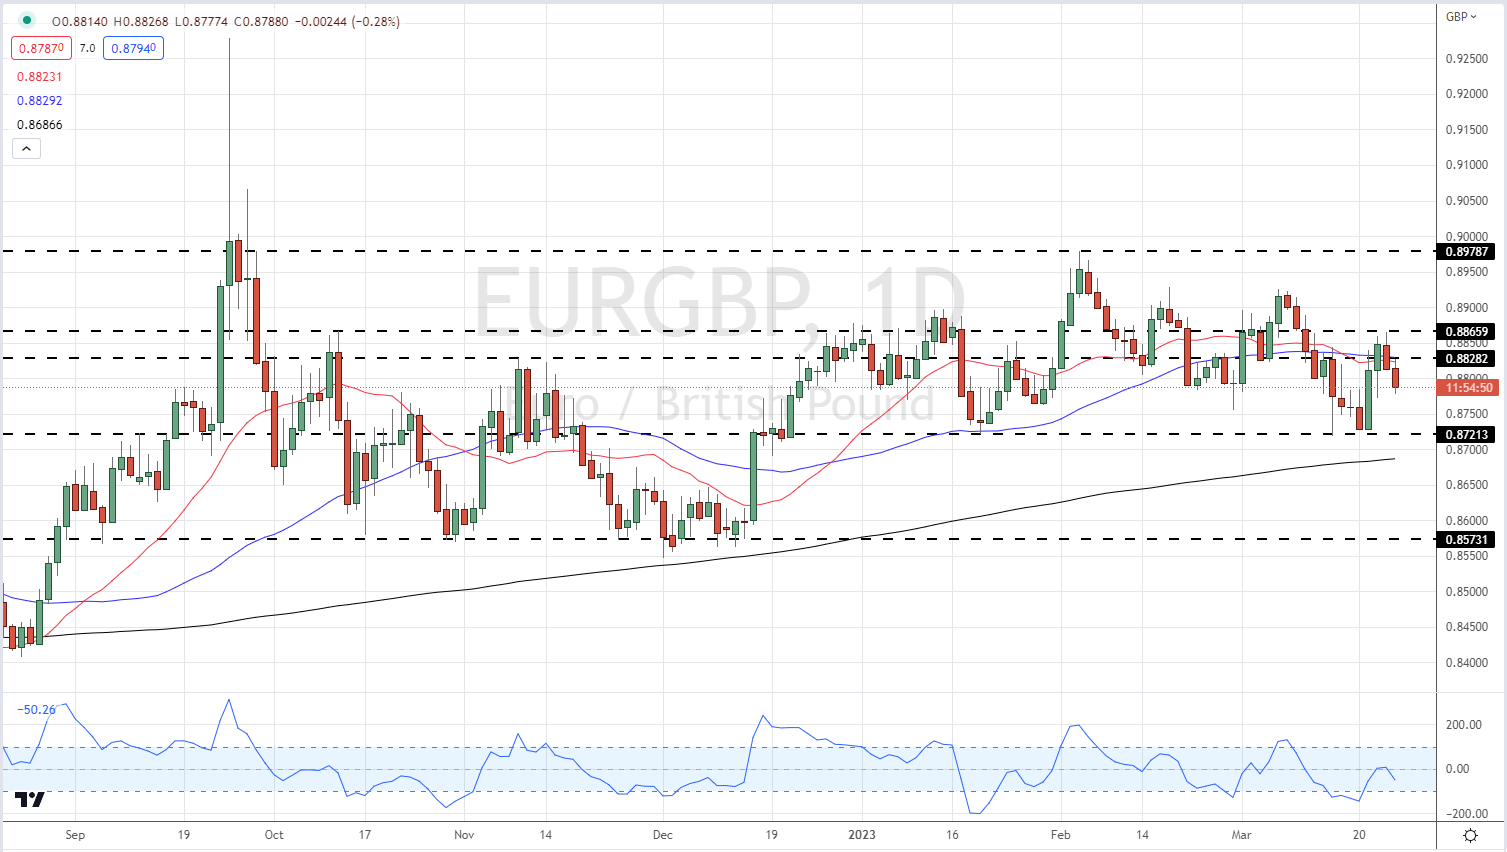
The Daily EUR/GBP chart again shows a fairly well-defined sideways pattern with support and resistance at 0.8712 and 0.8978 respectively. The support level looks reasonably strong having been tested and rejected over the last four months, and unless there is a fundamental change in the ECB’s thinking, or if a fresh Euro Area banking crisis hits, this level should hold. Just below support sits the 200-day moving average which will provide additional underpinning. A confirmed break above a recent double top around 0.8825/30 should allow the pair to re-test 0.8978 and potentially higher with little in the way of technical resistance above here.
EUR/GBP Daily Price Chart
Trade Smarter - Sign up for the DailyFX Newsletter
Receive timely and compelling market commentary from the DailyFX team