


UK British Pound Technical Outlook: Neutral
- GBP/USD drops back to support – Strong NFP report drives USD strength
- British Pound loses grip after running into resistance at 1.12
- Break below psychological support threatens potential recovery

GBP/USD Technical Resistance Drives a Move Back Towards 1.100
GBP/USD is currently testing another critical zone which continues to provide resistance at the key psychological level of 1.1500.
After recently reaching a fresh all-time low of 1.0354 last month, a rebound off 1.052 (the 1985 low) drove price action higher before reaching a new barrier of resistance at 1.1414.
With resistance forming at the March 2020 low, the formation of a long-wick candle on the weekly chart is suggestive of a strong rebound towards prior resistance turned support at 1.084.
GBP/USD Weekly Chart
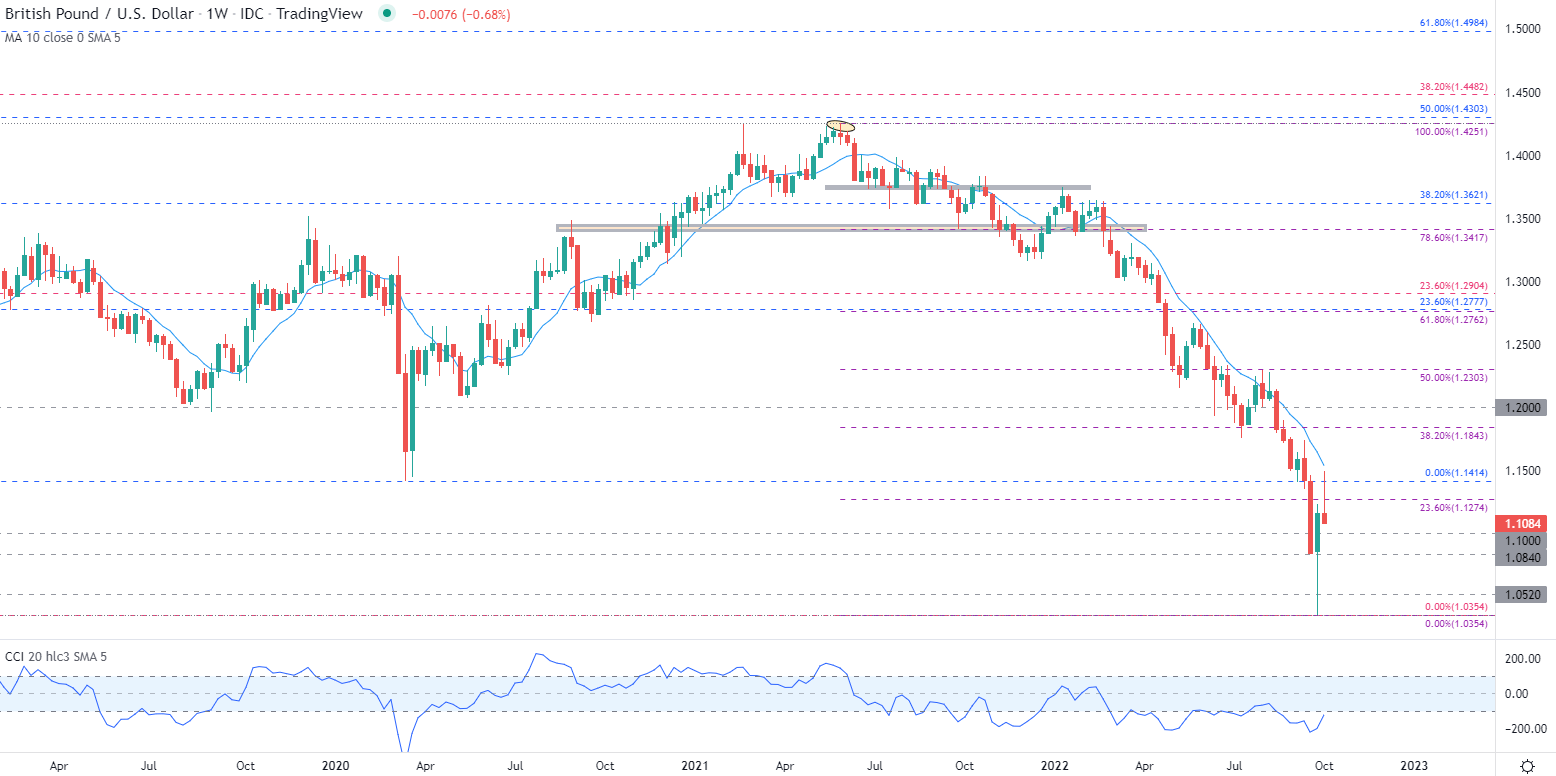
Chart prepared by Tammy Da Costa using TradingView
As the weekly CCI (commodity channel index) attempts to exit oversold territory, the 23.6% Fibonacci level of the 2021 – 2022 move has limited the upside move at 1.1274, bringing the 20-day MA (moving average) into play at 1.1235.
GBP/USD Daily Chart
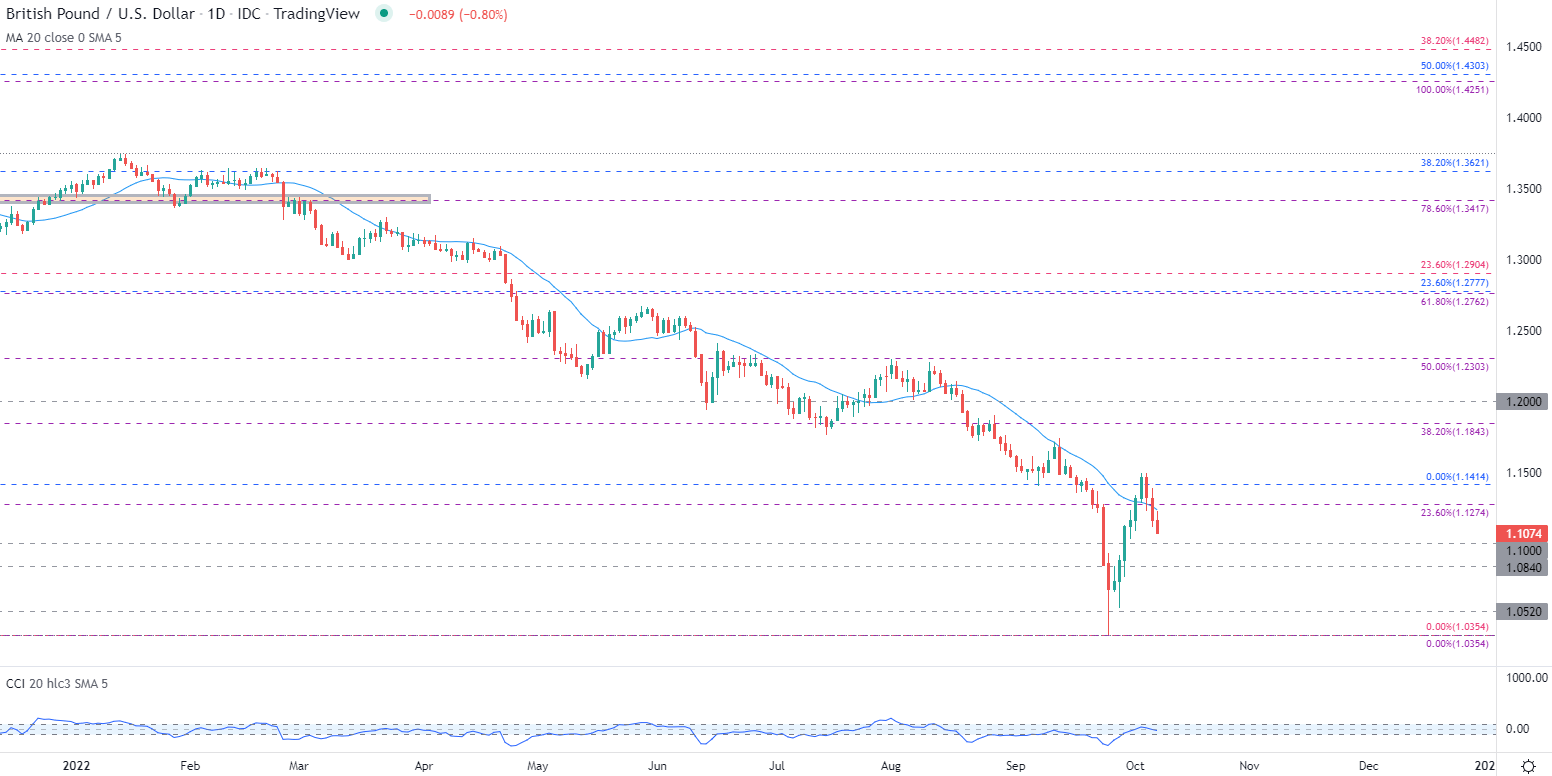
Chart prepared by Tammy Da Costa using TradingView
GBP/USD Technical Levels
For a revival of the uptrend, a hold above 1.100 and above 1.1274 could see a retest of 1.1414 with next big resistance at 1.1843 (the 38.2% Fib of the 2021 – 2022 move).
On the contrary, a drop below 1.11 could pave the way for 1.084 with the next barrier of support forming at 1.0354.
--- Written by Tammy Da Costa, Analyst for DailyFX.com
Contact and follow Tammy on Twitter: @Tams707


