


AUDUSD, NZDUSD, Dollar and AUDNZD Talking Points:
- The Market Perspective: AUDUSD Bearish Below 0.6850; NZDUSD Bearish Below 0.6200; AUDNZD Bullish Above 1.0875
- The Australian and New Zealand 2-year yields have been rising against their US counterpart these past weeks as speculation of a lower Fed terminal rate has grown
- AUDUSD is pressuring the midpoint of its past 9-month range at 0.6915 while NZDUSD is mired in the past two months range…all with US CPI due on Thursday

When it comes to the Dollar-based majors, the Greenback continues to exert undo influence over its peers. That means a market that can stall out or charge as much as it places the onus of bullish or bearish bearing on the single currency. At the moment, the US currency is under pressure; but it is struggling to project new lows. The masses seem to be waiting for a clear driver. US recession risks have been teased of late – including from the NFIB’s US business optimism indicator this past session – but the threat can seem somewhat abstract and ‘far off’ for the short-term opportunists. If we are going to gain traction on a bearish or bullish course on the Greenback, it would seem that the US CPI for rate speculation on Thursday or bank earnings on Friday for growth potential are top catalysts. In turn, anticipation could work against any productive movement we could see before we reach these updates.
When I am analyzing anything in the market, I prioritize fundamental influence. For a pair like AUDUSD, the US currency is vastly more liquid and thereby can overpower the impact of the Australian fundamental matters. That said, if the US docket and currency are in a holding pattern; the Australian counterpart can push the market higher or lower with the proper motivation. In the interim period until we hit the US CPI, the Australian docket will offer up November CPI and retail sales figures Wednesday morning and the same month’s trade balance early Thursday. Economic potential is a factor, but interest rate differentials seem to be the guiding light for now. As such, with AUDUSD on the threshold of the midpoint to the April 5th to October 13th range at 0.6915 and having just recently breached the 200-day moving average; it would seem the markets are looking for motivation. The inflation report may offer that short-term resolution, but the US CPI update could readily bully (or amplify) a move.
| Change in | Longs | Shorts | OI |
| Daily | -8% | -4% | -7% |
| Weekly | -3% | 49% | 4% |
Chart of AUDUSD with 50 and 200-Day SMAs, Overlaid with NZ-US 2-Year Yield Spread (Daily)
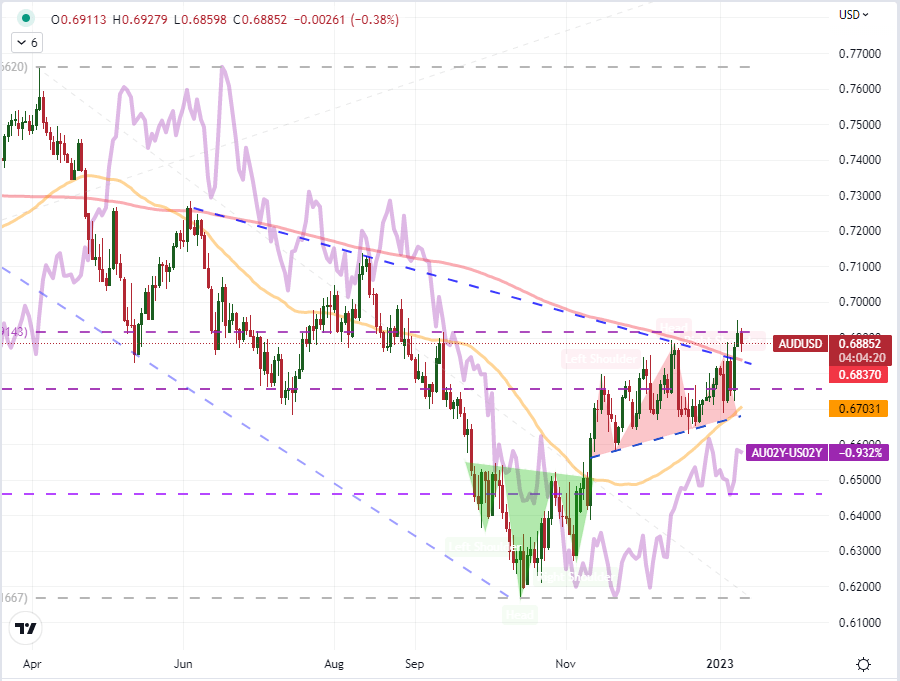
Chart Created on Tradingview Platform
As far as the hierarchy of ‘major’ currencies go, the New Zealand Dollar is even lower on the totem pole than its Aussie counterpart. It is even more distinctly represented by its high and AAA-rated sovereign debt yield, which is perhaps why the New Zealand – US 2-year yield differential represents a higher correlation to the underlying NZDUSD exchange rate. Fundamentally, the same criteria as the backdrop for AUDUSD exist; but the New Zealand docket is all but vacant for major market moving event risk. That will make it an unblemished view ahead for the US docket. What’s more, the technical picture doesn’t the immediacy of a technical resolution. We are treading in the middle of the past two months’ range with the midpoint of the March 2020 to February 2021 advance at 0.6460 and the December 13th high of 0.6515 offering the range of resistance. For the meaningful floor, the confluence of the 50-day SMA, 61.8 percent Fib of the aforementioned range and lows land around 0.6200-25.
| Change in | Longs | Shorts | OI |
| Daily | -6% | -7% | -6% |
| Weekly | 9% | -2% | 6% |
Chart of NZDUSD with 50-Day SMA Overlaid with NZ-US 2-Year Yield Spread (Daily)
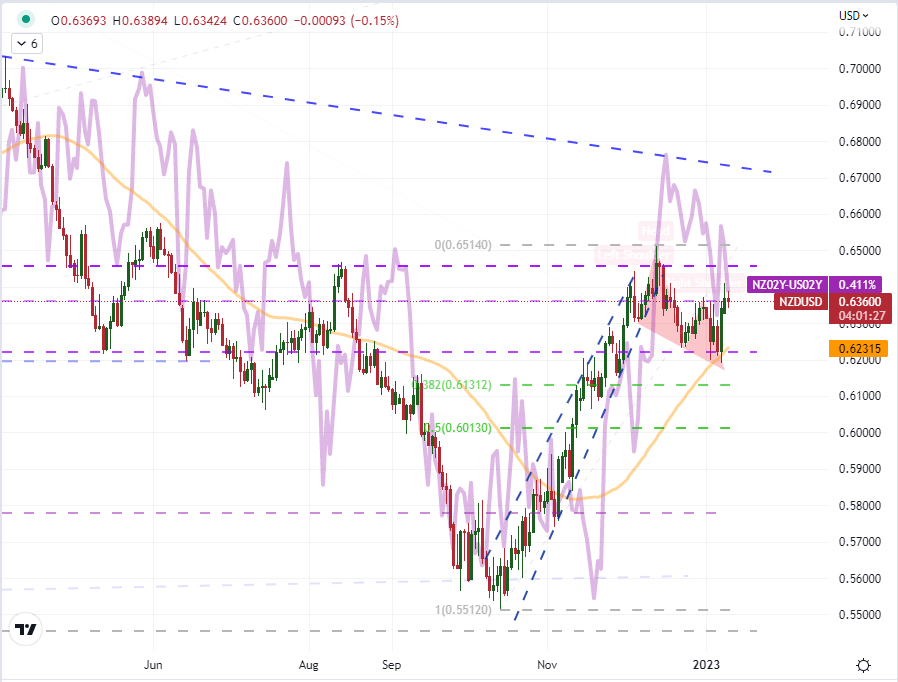
Chart Created on Tradingview Platform
What would an Australian and/or New Zealand picture look like without the overriding influence of the US Dollar? The combination of the two currencies presents a more refined picture of these ‘lower end’ majors with cleaner technical levels, more historical trend and a distinct fundamental backdrop. From the charts, the nascent bull trend following the December low (potentially qualifying as a ‘V bottom’ depending on the definition you prescribe to) has experienced some tight consolidation around the 38.2 percent Fibonacci retracement of the September 28th to December 16th leg lower. A break below this approximate 75 pip range would be a ‘path of least resistance’ as it moves back into established range and builds up consolidation. A bullish break would build upon a trend that would keep up productive market movement for a fourth consecutive month. Here, the Australian data can have more influence, so watch the releases.
Chart of AUDNZD with 20 and 100-Day SMAs, Overlaid with AU-NZ 2-Year Yield Spread (Daily)
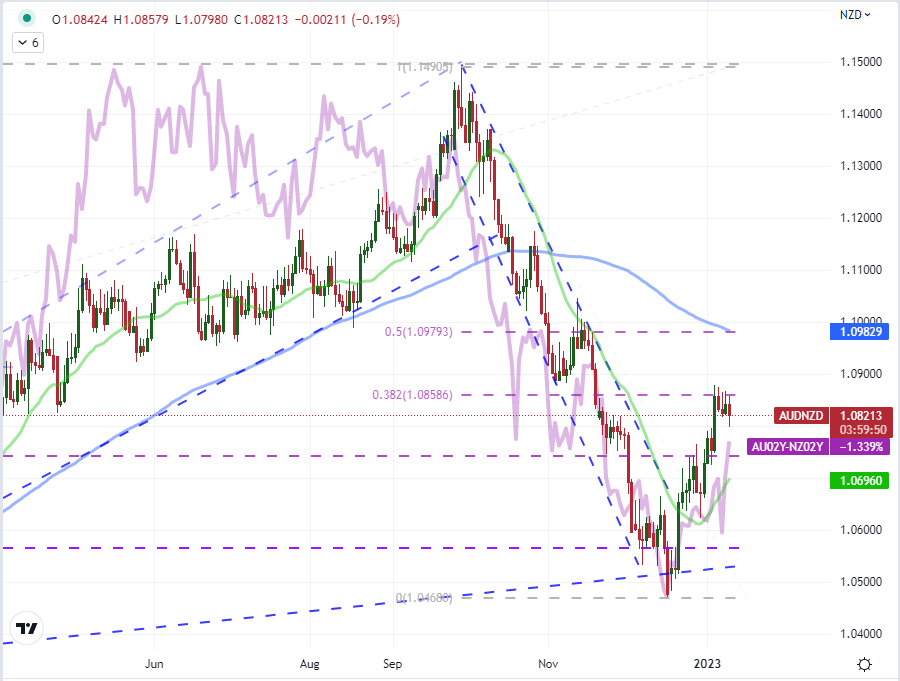
Chart Created on Tradingview Platform


