


A mixed showing in Wall Street eventually saw the Nasdaq pare its initial gains by the close, partly as optimism around Apple’s share price fizzled, following the unveiling of its augmented-reality headset, Vision Pro. The company’s share price briefly pushed to a new all-time high intraday but failed to find the commitment for a confirmation close. With overbought technical conditions and a rejection of its all-time high, any follow-through weakness from the index’s heavyweight (Apple) could mean downward pressure on the wider markets.
On the economic data front, further cracks in US economic conditions were unveiled with a downside surprise in the US ISM services PMI read (50.3 versus 52.5 forecast). While the moderation in its prices sub-index looks promising on the inflation front, the trade-off for growth is clearly presented with a decline in the services employment sub-index into contractionary territory while new orders slowed significantly. April’s factory orders underperformed as well (0.4% versus 0.8% forecast).
Weaker data brought Treasury yields lower, prompting the US dollar to pare its initial gains. A lacklustre US dollar is positive news for gold prices, which defended its key trendline support at the US$1,940 level, at least for now. Aside, optimism in oil prices on a lower-supply outlook largely saw some fading.
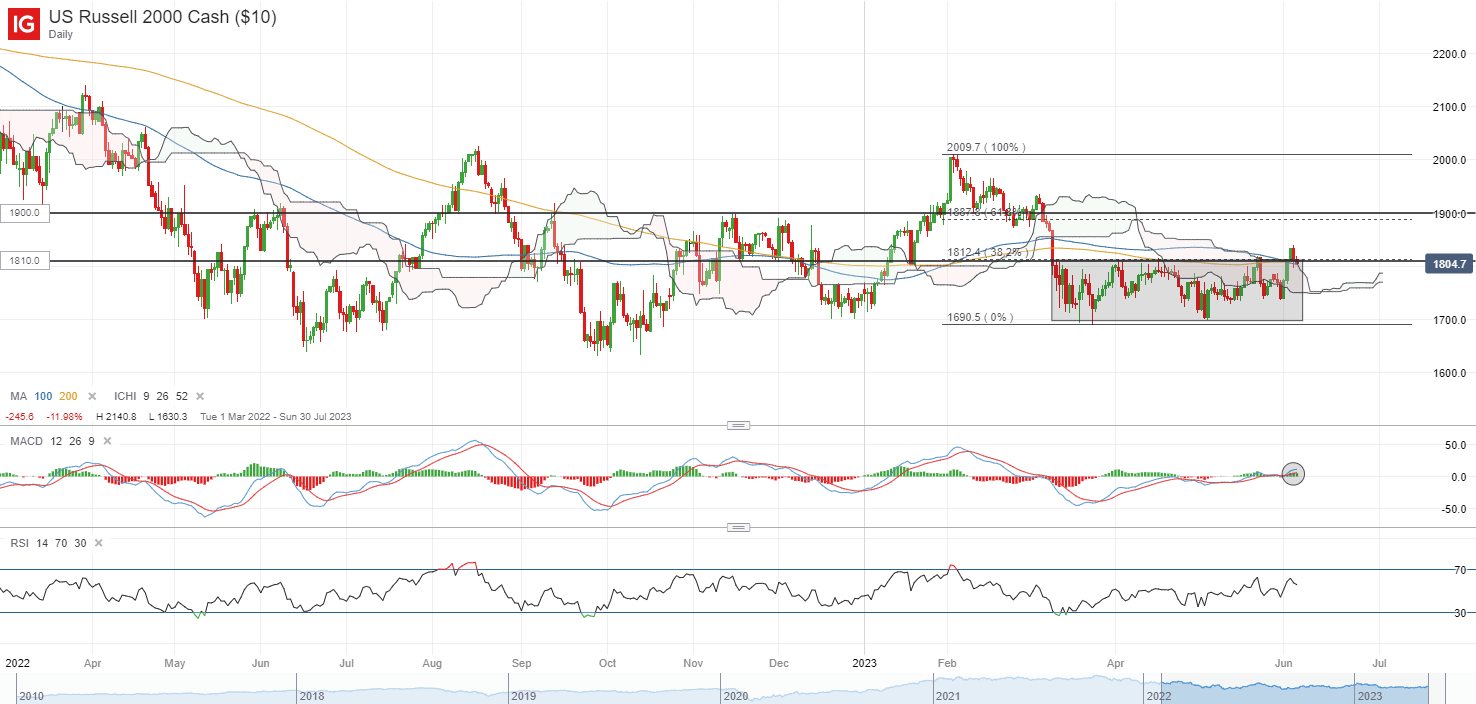
Having traded in a range since March this year, the break of the upper bound in the Russell 2000 index last week could reflect greater control from buyers but the new resistance-turned-support 1,800 level will have to see some defending ahead. Market breadth has been supportive for now, with the percentage of stocks above its 50-day moving average breaking to a new multi-month high. Any failure to defend the 1,800 level ahead could point to a potential false breakout scenario, which could draw some selling pressure in challenging the 1,740 level next.
Source: IG charts
Asia Open
Asian stocks look set for a downbeat open, with Nikkei -0.22%, ASX -0.72% and NZX -0.36% at the time of writing. South Korea markets are off for holiday.
The RBA interest rate decision will be the central event today, with cash rate futures pricing for a rate pause (64% probability) at the upcoming meeting but still expecting an additional hike in subsequent meetings. This leans towards a hawkish-pause scenario, as untamed inflation in April failed to provide the much-needed conviction for an extended pause.
Any hints towards the terminal rate will be on the lookout. Current market pricing are leaning towards the rate of 4.1% (current rate at 3.85%), which still suggests that we are heading towards the final phase of the tightening cycle. Any pushback on that front will likely prompt a hawkish recalibration in those expectations and be supportive of the AUD in the near term.
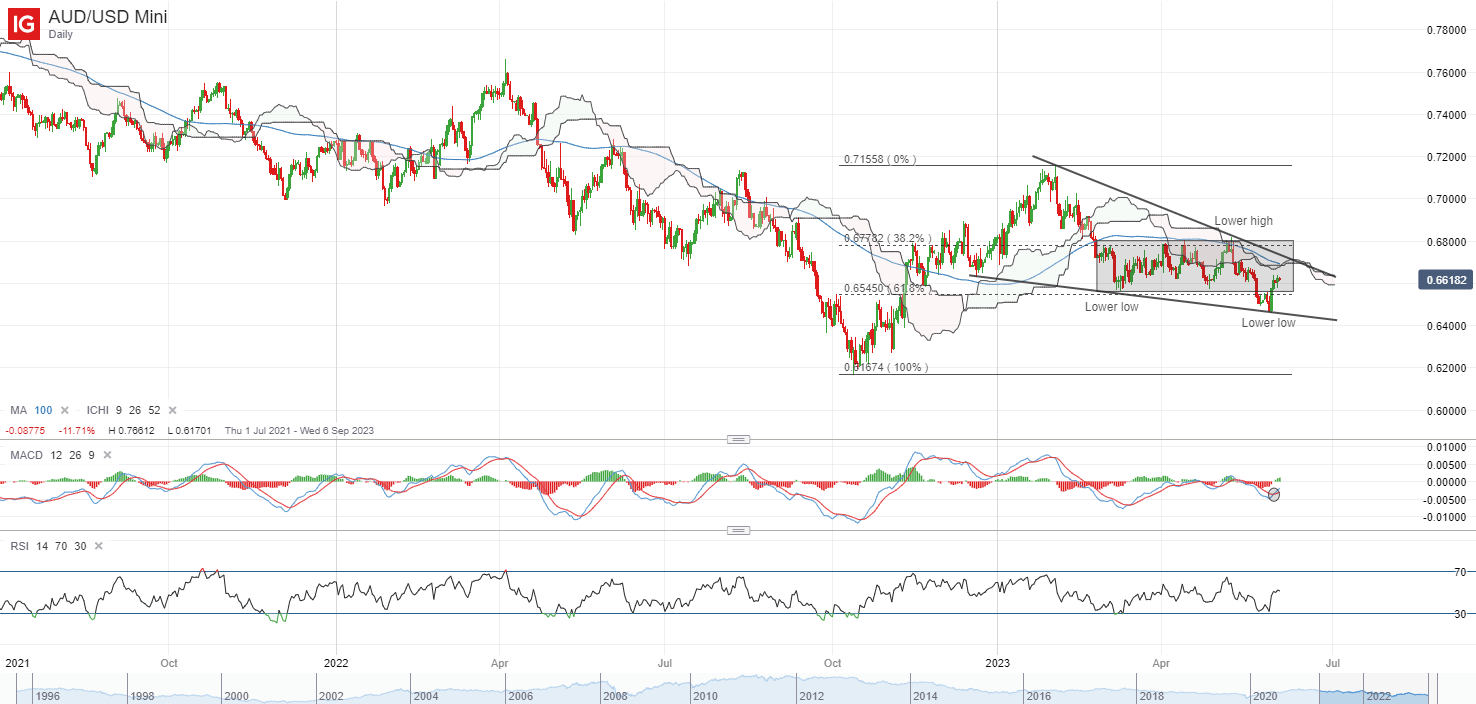
Having broken below the lower bound of a rectangle pattern (consolidation zone) in late-May, the AUD/USD is quick to reclaim the 0.656 level last week, with a bullish MACD crossover on the daily chart pointing to a potential turnaround in short-term momentum. That said, the pair seems to be trading within a falling wedge pattern on lower highs and lower lows since February this year, which could still leave a downward bias in place, until a series of resistance are overcome. This may include the upper wedge trendline resistance, its Ichimoku cloud, its 100-day moving average and the upper bound of its consolidation pattern, which could force the formation of another lower high.
Source: IG charts
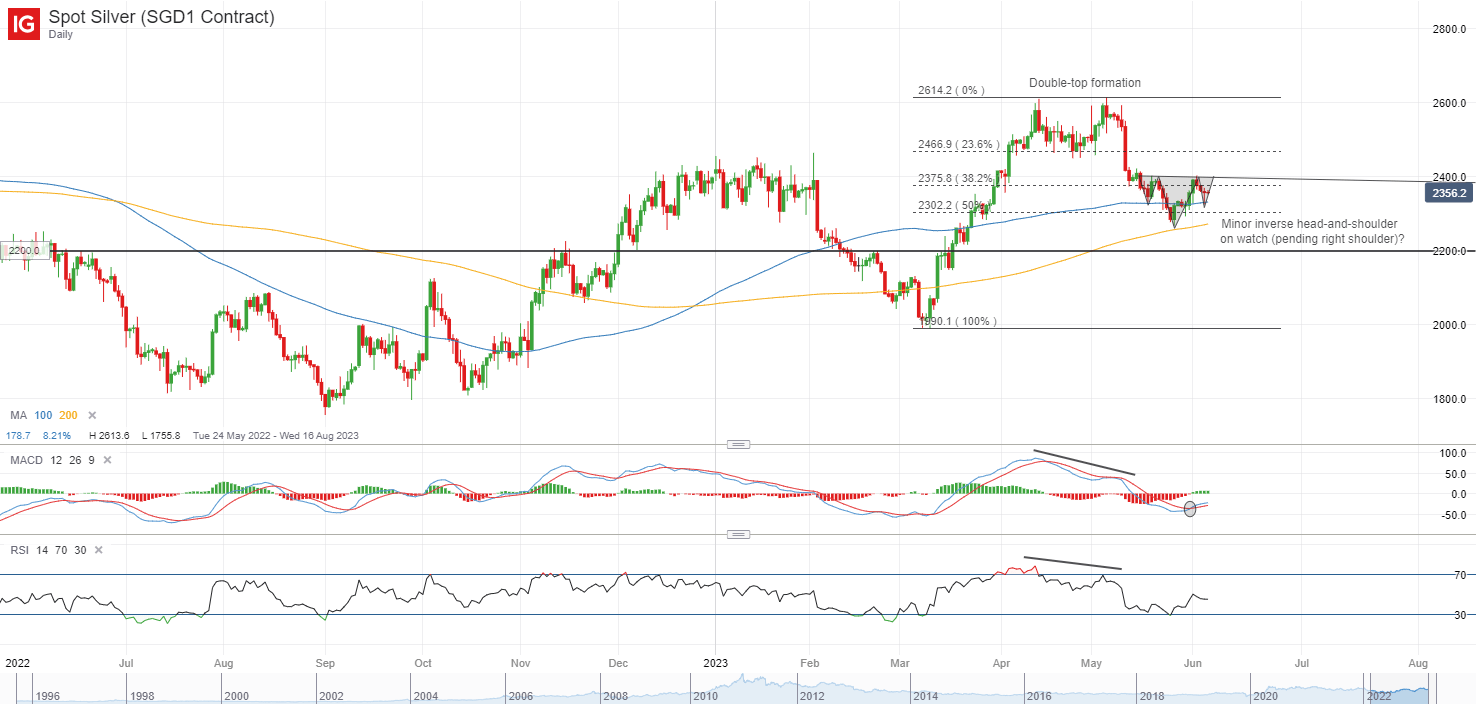
On the watchlist: Silver prices’ formation of bullish pin bar on retest of 100-day MA
A slight breather in the US dollar has translated to some resilience in silver prices overnight, as a retest of its 100-day MA was met with the formation of a bullish pin bar, reflecting signs of some near-term dip buying. Any upside at this point could potentially aid to complete the right shoulder of a minor inverse head-and-shoulder pattern in place since mid-May this year, although for now, it is still premature to conclude that the pattern will be formed.
The US$24.00 level will be the key resistance to overcome to provide greater conviction for the bulls. Prices have failed to move past the level on two occasions over the past month. Reclaiming this level may also mark a break of the neckline of the inverse head-and-shoulder pattern, potentially paving the way towards the US$24.70 level next.
Source: IG charts
Monday: DJIA -0.59%; S&P 500 -0.20%; Nasdaq -0.09%, DAX -0.54%, FTSE -0.10%
Trade Smarter - Sign up for the DailyFX Newsletter
Receive timely and compelling market commentary from the DailyFX team


