
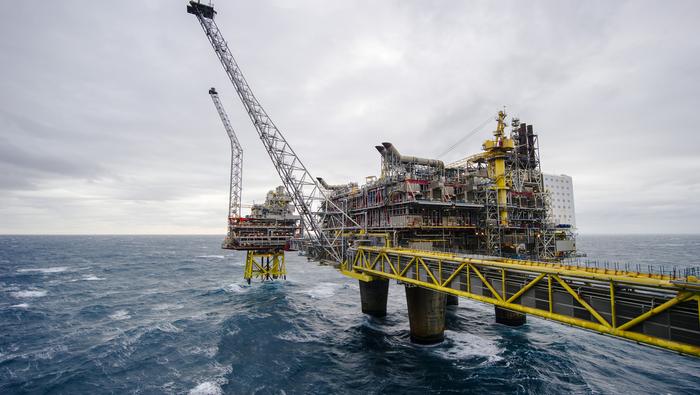
Natural Gas Prices

Natural Gas
 50m
50m
Last updated:
Apr 16, 2024
| Low | |
| High |
Average True Range
Total Intraday Range (% of ATR)
Note: Low and High figures are for the trading day.
Natural Gas prices fluctuate constantly, depending on factors such as supply and demand, weather, and the viability of alternative resources. As a traded asset, Natural Gas (NGAS) is popular due to its volatility, high liquidity and reasonable spread.Follow the Natural Gas price chart for live data and read our latest Natural Gas forecast, news, technical and fundamental analysis articles. Key pivot points and support and resistance levels provide further insights to help you make informed trading decisions.
Advertisement
News & Analysis
Crude Oil Correction in Play; Natural Gas’ Rebound May Not be Over
2023-10-23 02:30:00

Is the Rebound in Crude Oil Over? Natural Gas Holds Gains After Bullish Break
2023-10-13 02:59:00

Asia Day Ahead: STI at Key Support, Natural Gas Touches Eight-Month High
2023-10-05 02:00:00
Crude Oil to Test $100? Natural Gas is not Out of the Woods Yet
2023-09-17 04:00:00
Crude Oil Attempts to Clear a Tough Barrier; Natural Gas Risks Further Losses
2023-09-06 06:30:00
More Pain Ahead for Crude Oil? Is the Rebound Over in Natural Gas?
2023-08-29 06:30:00
Crude Oil Collapses as China Woes and US Dollar Strength Take its Toll
2023-08-16 05:00:00
Real Time News

Apr 16, 2024
Follow
Commodities Update: As of 18:00, these are your best and worst performers based on the London trading schedule:
Gold: 0.33%
Oil - US Crude: -0.05%
Silver: -2.00%
View the performance of all markets via https://t.co/WHTs8622rG https://t.co/GSdT8np3ey

Apr 16, 2024
Follow
IG Client Sentiment Update: Our data shows the vast majority of traders in AUD/USD are long at 80.41%, while traders in USD/JPY are at opposite extremes with 84.64%.
See the summary chart below and full details and charts on DailyFX: https://t.co/QeYdESR2tp https://t.co/qjExTqSRCM

Apr 16, 2024
Follow
Indices Update: As of 18:00, these are your best and worst performers based on the London trading schedule:
France 40: 0.43%
FTSE 100: 0.22%
Wall Street: 0.21%
Germany 40: 0.16%
US 500: -0.12%
View the performance of all markets via https://t.co/2NUaqnUPED https://t.co/jzgA9bCHol


Advertisement