
The FTSE 100 is a key barometer for the performance of the highest-capitalized companies on the London Stock Exchange (LSE). Read on for more on how the FTSE 100 is calculated, the history of the index, and the benefits of trading this asset.
What is the FTSE 100?
The FTSE 100 is a stock index representing the performance of the largest 100 companies listed on the LSE by market capitalization. It was originally one of the most popularly-traded indexes, as it was viewed as the best indicator of UK stock market health. However, as the FTSE 100 has expanded to include more multinational companies, the wider FTSE 250 index has become a more accurate representation of the UK economy.
The name FTSE 100, or ‘Footsie’, is a combination of the Financial Times and the London Stock Exchange. Although the initials ‘FTSE’ are often used synonymously with the FTSE 100 index, the FTSE Group has several other indices, including the aforementioned FTSE 250.
The counterparts of the FTSE 100 in Europe include the CAC 40 in France and the DAX 30 in Germany.
FTSE Index calculation
The FTSE 100 is capitalization-weighted, with the value of these weightings dependent on the market value of each stock. Although all its constituents rank among the top 100, their sizes can vary considerably – and on the FTSE 100 size equals influence. Accordingly, the most valuable companies in the index make more of a difference to the price than smaller companies.
The top ten companies account for roughly 40% of the index’s value, which means it is important to keep up to date on their share prices for an accurate FTSE 100 forecast. Changes are calculated in real time, so, as the share prices of companies move, the price of the FTSE 100 will adjust in response.
FTSE 100 companies
As of November 2019 the largest ten FTSE 100 companies by market capitalization are:
- Royal Dutch Shell
- HSBC Holdings
- BP
- Astrazenica
- GlaxoSmithKline
- Diageo
- British American Tobacco
- Unilever
- Rio Tinto
- Reckitt Benckiser Group
The single most represented sector on the index, as of 2019, is Financials at 20.65%, followed by Energy at 17.07%, and then Consumer Staples at 15.84%.
History of FTSE 100
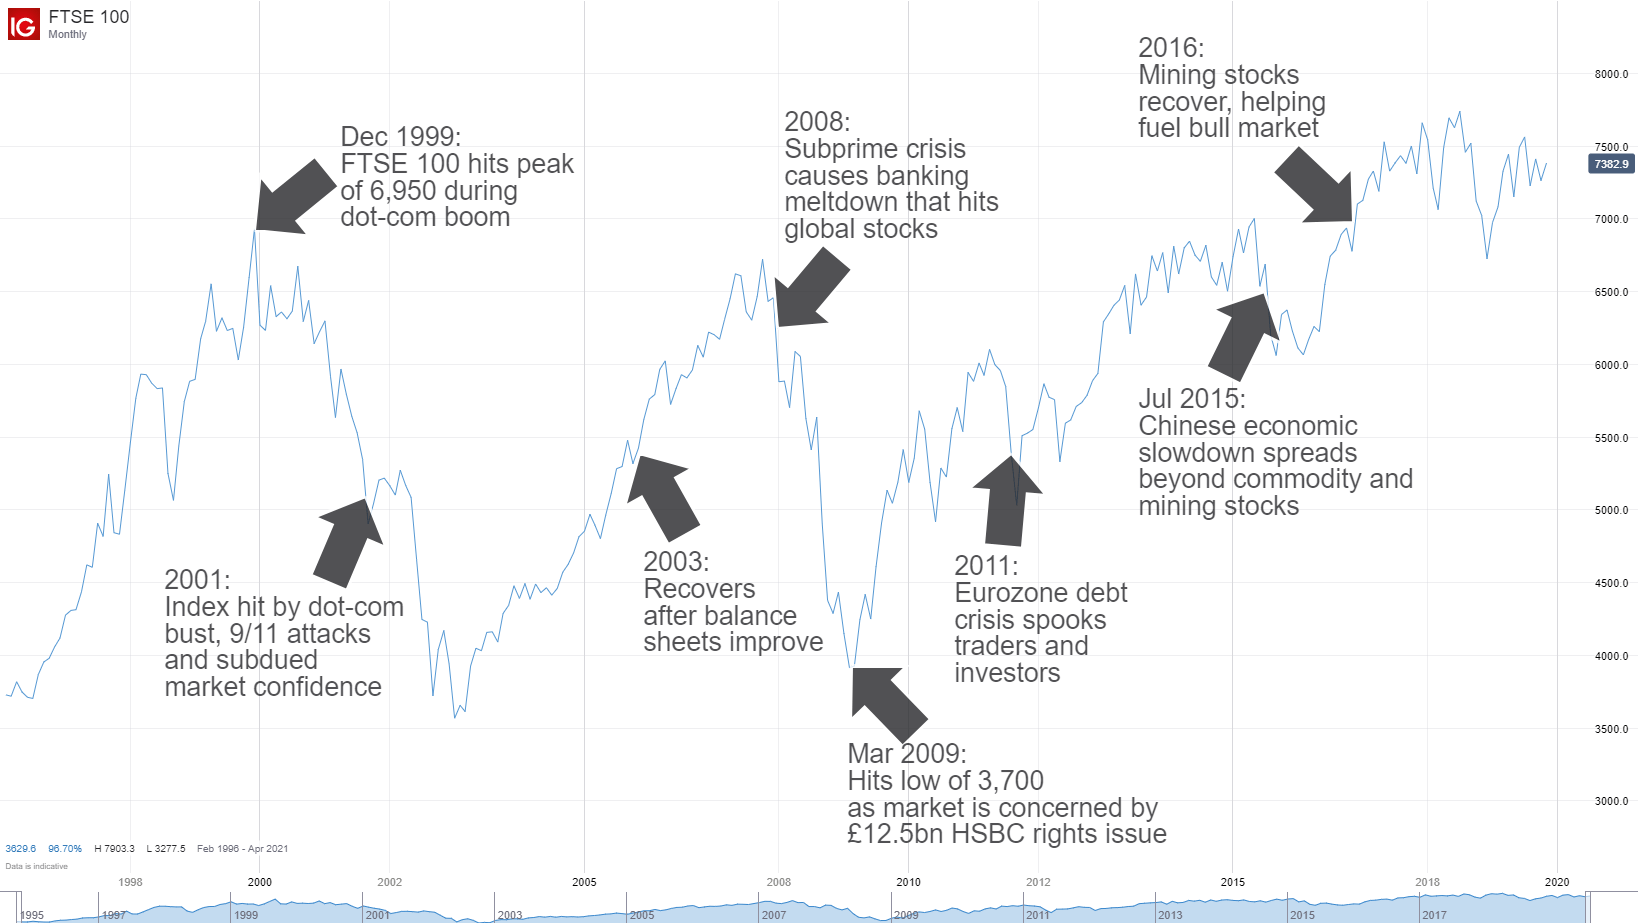
The FTSE 100 was launched on January, 3 1984 at an index level of 1,000, and had a combined value of approximately £160 billion, which was approximately 81% of the market capitalization of the wider LSE. In 2015, the FTSE 100 exceeded the 7,000 threshold for the first time – its previous record level being 6,930.2, which was reached during the dot-com boom in December 1999.
While some of the main patterns of the index broadly mirror the S&P 500 in the US, the latter has a history of outperforming the FTSE 100 by a considerable distance. This is down to the FTSE 100’s concentration of commodity and mining stocks, which have seen periods of poor performance in recent years, as well as its considerable exposure to emerging markets, which have also seen sluggish growth. Meanwhile, giant tech stocks such as Apple and Google have helped to bolster the S&P growth rate.
The below chart shows some key landmarks in the price of the FTSE 100 this century and the reasons for the swings.
What affects the price of the FTSE 100?
Traders should be aware of the factors that affect the price of the FTSE 100 in order to predict the likelihood of major movements. These include the strength of the Pound, earnings reports, and interest rate changes.
1. Strength of the Pound
Around three quarters of FTSE 100 constituent companies’ revenue comes from overseas, and a weaker pound means British goods are cheaper to buy. This could potentially boost exports – and elevate the FTSE 100 price in turn.
2. Earning reports
Earning reports have the capacity to move stock prices and indexes in turn. As the index is weighted, a positive or negative earnings surprise in the top ten stock, for example, can have a meaningful impact on the price of the index as a whole.
3. Interest rate changes
When interest rates rise, equities and indexes may fall due to companies facing larger repayments on debt, resulting in decreased profits.
Navigating the FTSE 100
The FTSE 100 can be traded through FTSE 100 futures and options, and exchange-traded funds (ETFs). The index carries a high level of liquidity and tight trading spreads, and the potential for clean technical patterns across a range of timeframes. Also, the index is capable of showing volatility that can provide opportunities for traders.
DailyFX also offers more technical advice on how to trade FTSE 100, looking at strategies, expert tips and trading hours.
Find out more about the FTSE 100
Stay up to date with the FTSE 100 chart and find the latest news, forecasts and expert analysis on our FTSE 100 page. Our free quarterly equities forecast will also provide more in-depth predictions.