
AUD/CAD

AUD/CAD
 1h
1h
Last updated:
Apr 18, 2024
| Low | |
| High |
Average True Range
Total Intraday Range (% of ATR)
Note: Low and High figures are for the trading day.
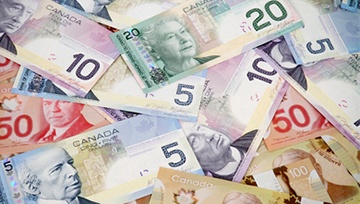
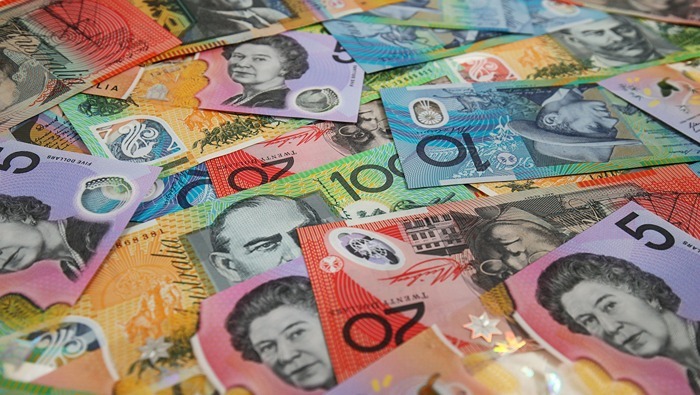
Australia's ties to China and the 'hard' commodities it produces have fostered a historical relationship between the local currency and precious metals. The value of the Canadian Dollar is strongly correlated with the price of crude oil as the country remains a dominant exporter of the commodity. Both currencies are therefore sensitive to broader commodity price trends.
Advertisement
News & Analysis
Canadian Dollar Outlook After BoC Stands Pat: USD/CAD, EUR/CAD, AUD/CAD
2023-10-30 02:00:00
Australian Dollar Jumps on Shocker CPI Data. Will AUD/USD Go Higher on an RBA Hike?
2023-10-25 00:30:00

Australian Dollar Hurt by Dampened Risk Appetite; AUD/USD, AUD/CAD, AUD/SGD Price Setups
2023-08-03 06:30:00
Australian Dollar Skips a Beat on New RBA Governor Michele Bullock's Appointment
2023-07-14 00:00:00
USD/CAD Forecast: 1.3000 Beckons as Dollar Index (DXY) Slide Continues
2023-07-13 15:34:04
Australian Dollar Outlook: Central Banks Continue to Grapple with CPI
2023-07-07 20:00:00
The Bank of Canada: A Trader’s Guide
2023-06-06 19:09:59
Real Time News

Apr 18, 2024
Follow
Commodities Update: As of 18:00, these are your best and worst performers based on the London trading schedule:
Gold: 0.87%
Silver: 0.13%
Oil - US Crude: -0.02%
View the performance of all markets via https://t.co/WHTs8622rG https://t.co/VPVKQW7f8E

Apr 18, 2024
Follow
IG Client Sentiment Update: Our data shows the vast majority of traders in AUD/USD are long at 78.94%, while traders in USD/JPY are at opposite extremes with 83.41%.
See the summary chart below and full details and charts on DailyFX: https://t.co/QeYdESR2tp https://t.co/GLdY5el8x8

Apr 18, 2024
Follow
Indices Update: As of 18:00, these are your best and worst performers based on the London trading schedule:
Wall Street: 0.01%
US 500: -0.16%
FTSE 100: -0.30%
France 40: -0.35%
Germany 40: -0.60%
View the performance of all markets via https://t.co/2NUaqnUPED https://t.co/Jfq4pJJfGQ


