


Talking Points:
- Two axioms to remember: markets can remain rational than we remain solvent and true reversals happen extraordinarily infrequently
- US indices suffered an extreme loss this past session with the S&P 500 working on its worst month since February 2009
- The primary qualifier of a true reversal is follow through - but there are more timely ways to help qualify than 'after the fact'
What makes for a 'great' trader? Strategy is important but there are many ways we can analyze to good trades. The most important limitations and advances are found in our own psychology. Download the DailyFX Building Confidence in Trading and Traits of Successful Traders guides to learn how to set your course from the beginning.
An Extreme Day
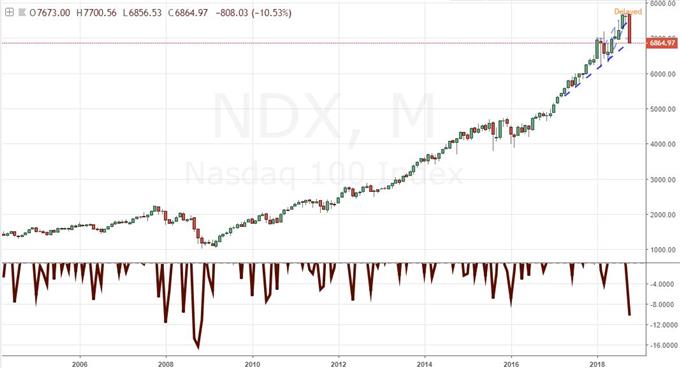
By most metrics, the performance from US equity indices Wednesday was exceptional. The blue-chip Dow Jones Industrial Average dropped 2.4 percent while the broad S&P 500 fell 2.5 percent. For both, the single-day slide was only the largest red day in a few weeks. However, there have been very few of these intense retreats in the past few years. What's more, the additional loss of altitude is putting this market on pace for a slump that could set a permanent reversal in course. From its peak high set earlier in the month, the Dow is down almost 9 percent, currently pacing the worst monthly performance for the index since March 2010. As for the S&P 500, it is within stone's throw of a 10 percent slide from the September 21 intraday high - which would qualify as a technical 'correction'. For scale, the tech-heavy Nasdaq has registered the most remarkable pain both for the past session and this month. Once the high-flyer of this outperforming regional asset class, the 4.4 percent drop was the steepest single-day decline since August 2011, and if the month were to close out right now, it would be the worst showing in exactly a decade. And, comparisons to the height of the Great Financial Crisis rarely carry a positive connotation. For some, the severity of the session's losses are motivation to call a bottom. However, a complete flush that preempts a reversal usually comes after a systemic and/or long retreat. We have yet to see that degree of capitulation.
Nasdaq Chart and Pace of Return (Monthly)
The Importance of Rational Evaluation in the Heat of the Moment
For someone like myself, the tumble that we have seen unfold in October looks to be the start of a long over-due retreat in an excessive build up in speculative interests. I have held a bearish view on the disparity between price and value for risk-leaning markets for a number of years now. I do not say that to signal some vindication from recent price action, but to point out the importance of timing and conviction. Had I acted on my bearish views back in 2015 when they were starting to form, I would have been delivered a crushing loss as momentum continued to carry speculative exposure higher and higher. It is important to formulate a view on underlying value of a market, but acting on that assessment only makes sense when the speculative masses share the perspective - whether via the same underlying reasoning or simply through kismet of convenient bedfellows. There are two market axioms that come to mind when we see market conditions akin to what was registered this past session. The first is the saying attributed to famed-economist John Maynard Keynes and are more commonly quoted as 'the market can remain irrational longer than you can solvent'. Trading one's own convictions does not always translate into trading the market's reality. Another observation is one more readily established in statistics rather than through a single person. True reversal of trend - rather than temporary setbacks in prevailing trends - occur very rarely in the course of long span of time. To persistently call reversal is to defy the logic of the markets.
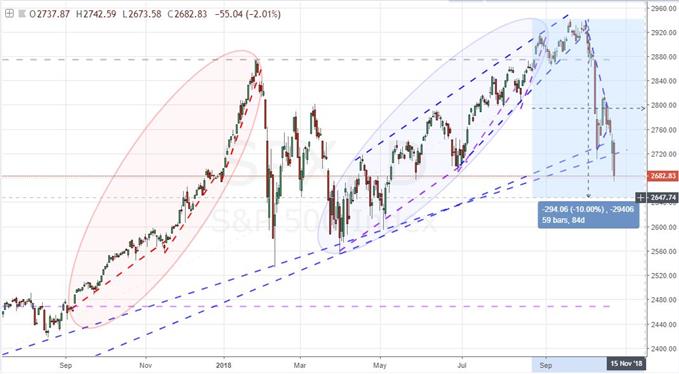
Daily Chart of S&P 500
What Is the Single Best Signal of a Breakout or Reversal?
So, if we are looking for a single factor that could be most relied upon to indicate a systemic reversal or critical break with trend intent, what would it be? I think that few would dispute that indication of follow through would be the most appealing signal upon which an investor would act with confidence. That said, establishing true follow through only happens after the fact when the trend has been established...and the opportunity squandered. Of course, there are qualifiers that can be utilized that don't necessitate the market passing us by. Rather than relying on a severe move over a short period or the break of a particularly prominent technical barrier, the correlation of various speculative assets can prove the technical trader's equivalent measure of a seismic motivation. We can get a similar assessment from a more comprehensive fundamental evaluation. If there is a specific response to trade wars, earnings or geopolitical risks surrounding nuclear agreements among other issues, we can follow the drive as the theme runs. So, is this October retreat the makings of a systemic and deep reversal? We discuss that in today's Quick Take video.


