


Trading Strategy talking points:
- This is a video of an archived webinar in which I looked at numerous markets including FX markets like the US Dollar and EUR/USD, as well as macro items like rates and how that might impact stocks.
- Rates have been pulling back of recent despite an inverted yield curve. I discussed this topic a little later in the webinar and what I think it means. Notably, today has seen a stark jump in rates on the heels of some Fed-speaker comments. But, as yet, stocks haven’t violated support.
- The analysis contained in article relies on price action and chart formations. To learn more about price action or chart patterns, check out our DailyFX Education section.
- Quarterly forecasts have just been released from DailyFX and I wrote the technical portion of the US Dollar forecast. To get the full write-up, click on the link below.

We’re at an interesting juncture in markets where there’s two defined camps. The first camp is bullish, with many thinking that stocks have already bottomed. This point of view is also usually harboring the expectation that rates have topped – and that the Fed is perhaps even nearing the end of their hiking cycle. This side can point to Chair Powell’s remarks at the last FOMC rate decision regarding the fact that, in his opinion, we’re now at the neutral rate. And he also opined that it’d be an opportune time to revert to a more data dependent mode, which, again, illustrates that maybe the Fed thinks they’ve made enough moves to begin addressing inflation?
This camp can also point to much of the past 13 years since the Financial Collapse at the pattern presented by the Fed, where economic distress was quickly offset by more and more accommodation. Case in point – not even a global pandemic could keep markets down, as the liquidity engine went into fire less than two months after covid touched the US and a few months after that the S&P 500 was already at a fresh all-time-high.
The other camp looks at inflation still at 9% and thinks that, well, something must be missing from those in the first camp, to put it politely. This camp also has about nine months of FOMC commentary pointing to the importance of addressing inflation and, logically, the need to do so ahead of mid-term elections later this year. Americans often vote with their pocketbooks and with so much turmoil around inflation, it’s difficult to imagine a positive outcome for the incumbent party, which makes for an awkward setup going into the 2024 general election.
So, the question really boils down to a two-pronged dilemma: How serious is the Fed about fighting inflation? Are they actually willing to drive the S&P 500 down to say, 3000 or perhaps even 2500? And, more aptly, how much will the rate hikes that they’ve already put in make a dent?

Rates Markets
It’s important to point out that the Fed does not control rates markets. They do control Fed Funds but this is ultra-short-term lending. That logically should feed across the yield curve so that when the Fed hikes short-term rates, long-term rates, bearing more risk for additional time, also increase.
When that breaks down that something is amiss…
For much of this year, treasury rates tracked those rate hikes from the Fed in a general sense. As the Fed boosted rates, treasury rates also increased. Until the June rate decision, that is. The 10 year topped around that 75 bp hike with a yield at 3.5% - and then proceeded to pullback, through the July rate hike and into today.
Now, the reason this is important is because this was one of the variables that was helping to boost stock prices, driven by those in camp one who thought that, perhaps the Fed was nearing completion of their rate hikes? So as yields have been dropping since that June rate decision, stock prices have been jumping.
But that started to change today as the Fed is now out of their blackout period, and we’re hearing from multiple Fed members, such as Mary Daly, saying that the bank is ‘nowhere near done.’ We’ve also heard from Neel Kashkari and Charlie Evans, both noted doves but they were speaking in a hawkish manner, somewhat similar to Ms. Daly. In response, we’re seeing a large move in the 10-year which is also showing a bullish engulfing pattern.
US 10 Year Rates
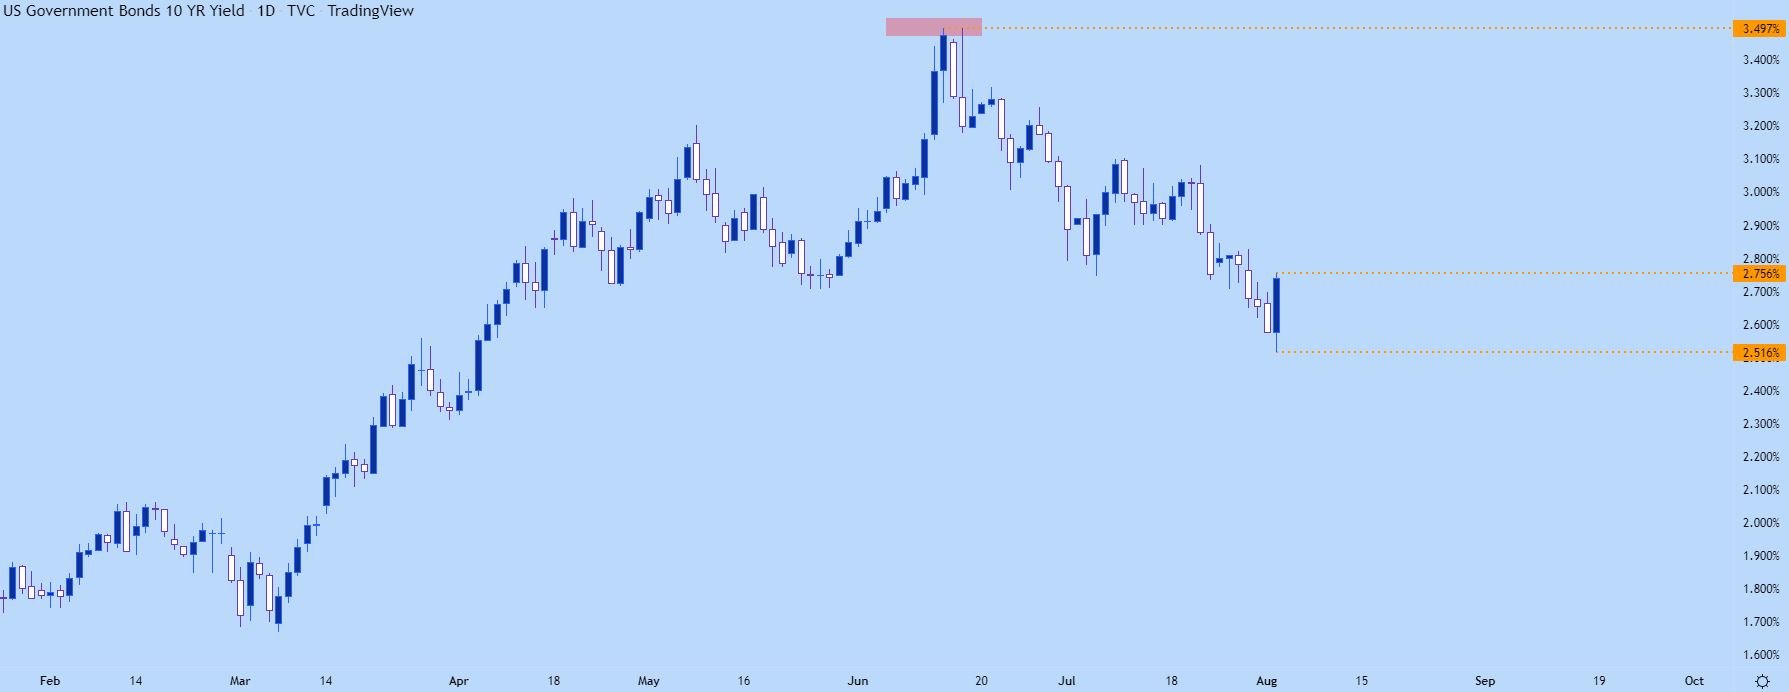
Chart prepared by James Stanley; 10 year rates on Tradingview
Treasury Curve
This boost in yields is uneven, unfortunately, with short-term yields seeing a larger move today than longer-term yields. Another way of putting that is that the yield curve is getting more and more inverted, which is not a bullish sign.
In the webinar I gave a pretty in-depth description of why that happens.
The 2/10 yield curve is now at it’s most inverted since September of 2000 – so even before George W. Bush’s presidency.

US Treasuries 2/10 Yield Spread

Chart prepared by James Stanley
USD
The biggest beneficiary of this in the FX space is the US Dollar. I had published a US Dollar Price Action Setups installment earlier today, and I highlighted a USD at a key spot of support, after building in a falling wedge pattern, which had taken on the form of a bull flag.
Today’s boost in rates and, in-turn, the USD has helped DXY to recover. It’s now at that key point of test that I had highlighted earlier today, at the 38.2% Fibonacci retracement of a recent topside move. A bullish break outside of the wedge keeps the door open for continuation in the USD, and there’s a big push point on that theme that I’ll look at below.
US Dollar Daily Price Chart
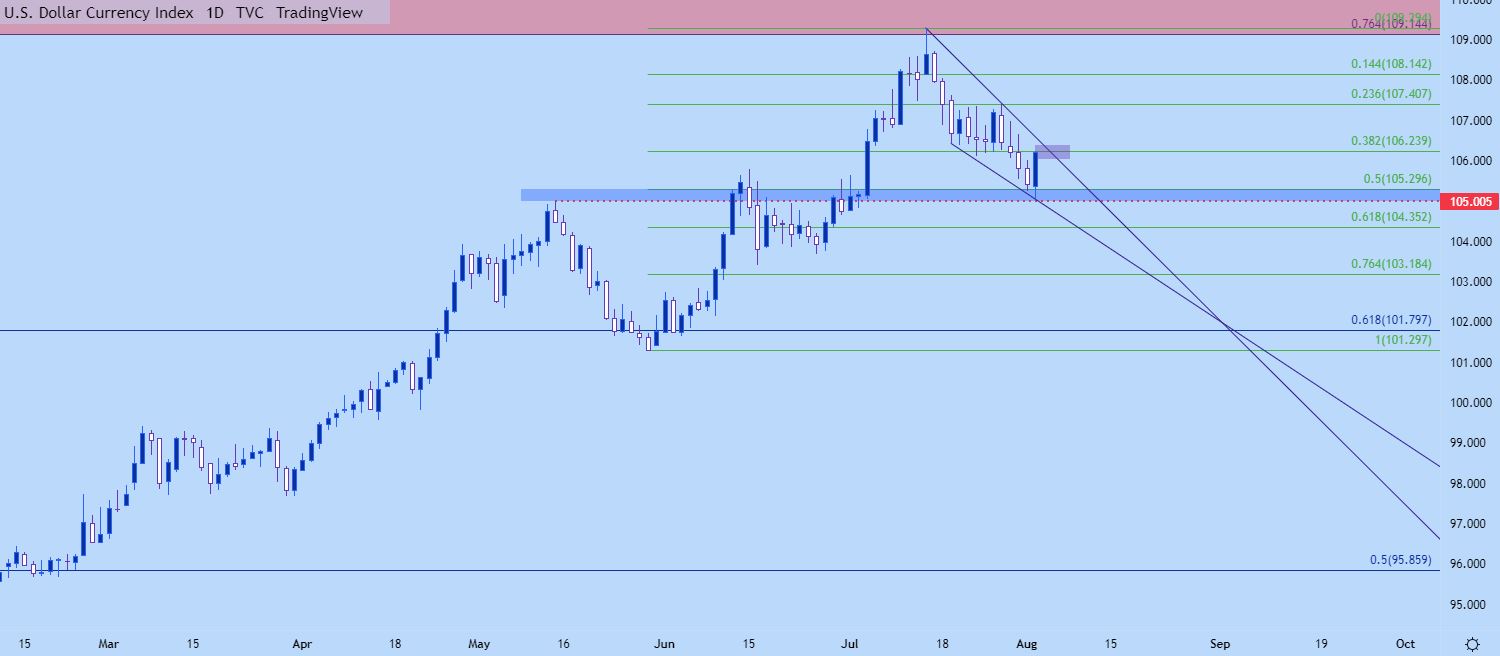
Chart prepared by James Stanley; USD, DXY on Tradingview
EUR/USD Bearish Engulf
This daily bar isn’t finished yet but, it looks like it might close as a bearish engulf. If so, this could present some possible change to what’s become an otherwise boring story in EUR/USD. Through both the ECB’s lift-off 50 bp hike and the Fed’s most recent 75 bp hike, EUR/USD has remained in a rectangle formation.
That started to give way yesterday when bulls forced their first close above 1.0233 in almost a month. But sellers have responded here and the bearish engulf on the daily, in the direction of the general trend, can re-open the door for bearish continuation strategies in EUR/USD, and this could sync with bullish strategies in the USD looked at above.
In my opinion – I would’ve preferred a deeper pullback. The 1.0340 level is a big one as this was the 19-year low for quite some time, and it even held the sell-off for a couple of months before finally breaking down. Ideally, I’d want to see that level tested as resistance before plotting for a parity re-test and, perhaps even, a break.
But that’s price action. React or not, it doesn’t care about what I want.

EUR/USD Daily Chart
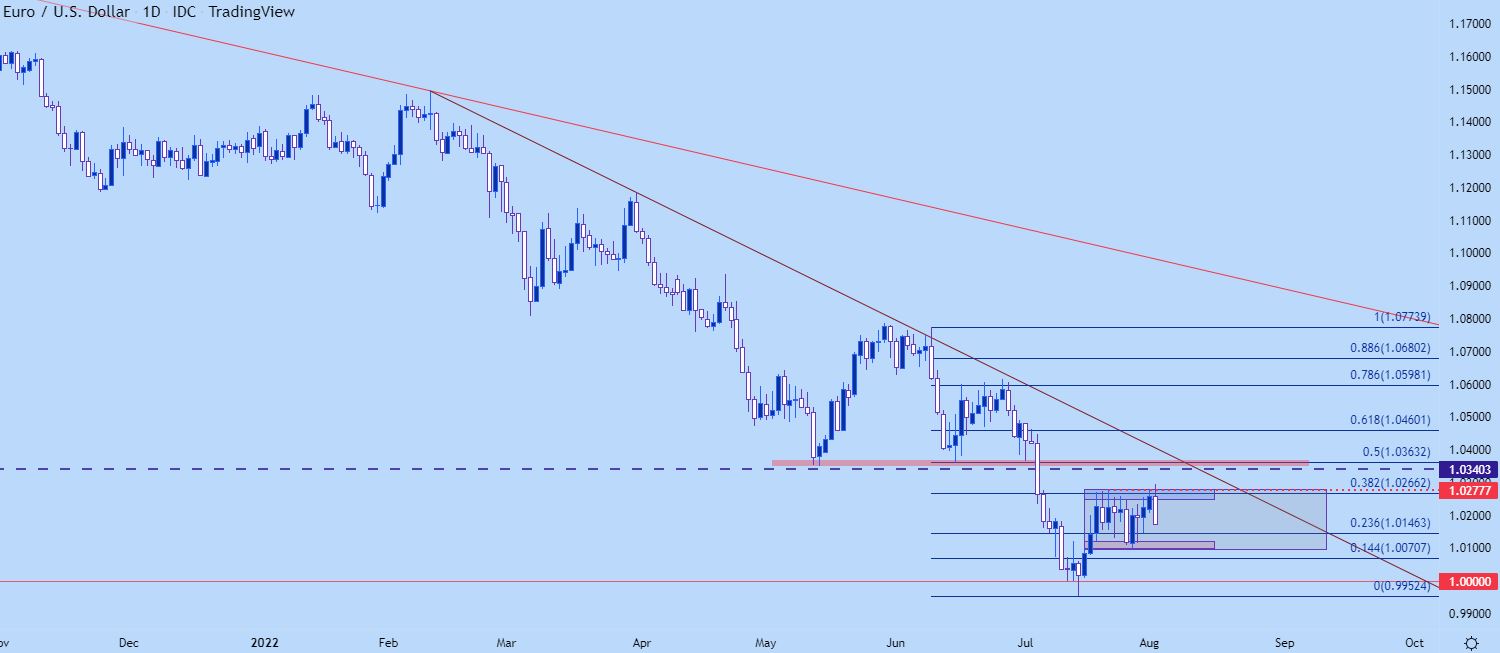
Chart prepared by James Stanley; EURUSD on Tradingview
S&P 500
The big question around rates is – are stocks going to respond?
Rising rates became a big problem for equities in the first-half of the year and this led to a 25% pullback in the S&P 500 to go along with the 34% drawdown in the Nasdaq 100 (from the November 2021 high).
But, since mid-June, around the FOMC rate decision and around when rates had topped – stocks have been shooting-higher ever since.
In the S&P 500, there was a falling wedge formation, often tracked with the aim of bullish reversals. And reverse it did as prices broke out a couple weeks ago and continued to jump to fresh higher-highs.
Price action has begun to stall – and we’re now starting to see inside bars print on the four-hour chart, illustrating some potential for shift in the near-term. As I wrote in this week’s technical forecast, there’s more resistance around the 4200 level, so if this trend does extend, there’s another spot for sellers to watch. But, near-term, the Fibonacci level at 4085 has held support on Friday and again today – a breach below that opens the door for a deeper pullback, which brings the 4000-4016 zone back into the equation.
If sellers are able to push back-below the 4k psychological level, bears will have a bit more to work with and that may be signaling the return of the bullish trend. It’s still early, but given the current backdrop, there’s potential.
S&P 500 Daily Chart

Chart prepared by James Stanley; S&P 500 on Tradingview
--- Written by James Stanley, Senior Strategist, DailyFX.com & Head of DailyFX Education
Contact and follow James on Twitter: @JStanleyFX


