


Talking Points
This is an archived webinar from June 7th, 2022. I looked at a variety of items ahead of next week’s FOMC rate decision and if you’d like to sign up for the next webinar, the link below will set that up. If you’d like to learn more about the style of analysis being used, most of what was discussed in this webinar came from price action and chart formations, which we share at DailyFX Education.
Thursday ECB: This Thursday brings a rate decision out of the European Central Bank. There’s little expectation of any hikes at this meeting but, given the 8% inflation in Europe the logic dictates that the bank will start opening the door for such at some point later this year, possibly as early as July.
This has a large impact because the central part of today’s discussion is how interest rate expectations drive FX flows, and with expectations increasing for higher rates out of Europe, the Euro has shown a pattern of strength over the past few weeks. This has been especially impactful in EUR/JPY, as another run of Yen-weakness appears to be underway, bringing us to the net major topic.
I had looked deeper into the Euro in yesterday’s Euro Price Action Setups article.

JPY Weakness Dominates FX: I hadabit on this as I had shared that Yen trends, when in order, can be some of the most attractive trading venues available. Into 2009 and 2010, that was generally set up around Yen-strength. But, after 2012, Yen-weakness was a common driver as the Bank of Japan moved to an uber-loose policy outlay that remains in-effect today.
As many other economies have started to see inflation from their own monetary operations, interest rates have increased as have rate expectations for future moves. But, in Japan, inflation remains at 2.5% and earlier this week BoJ Governor Kuroda said that there’s little interest in shifting until the bank has attained ‘stable’ inflation at 2%. That 2.5% print last month was the first inflation print above 2% since 2008 so, his comments were read as an open door for Yen-weakness, which has continued to show this week with USD/JPY jumping up to another fresh 20-year-high.
I had looked into the Yen in greater detail in this morning’s article, Japanese Yen Price Action Setups: USD/JPY, EUR/JPY, GBP/JPY, AUD/JPY.

USD/JPY Daily Price Chart
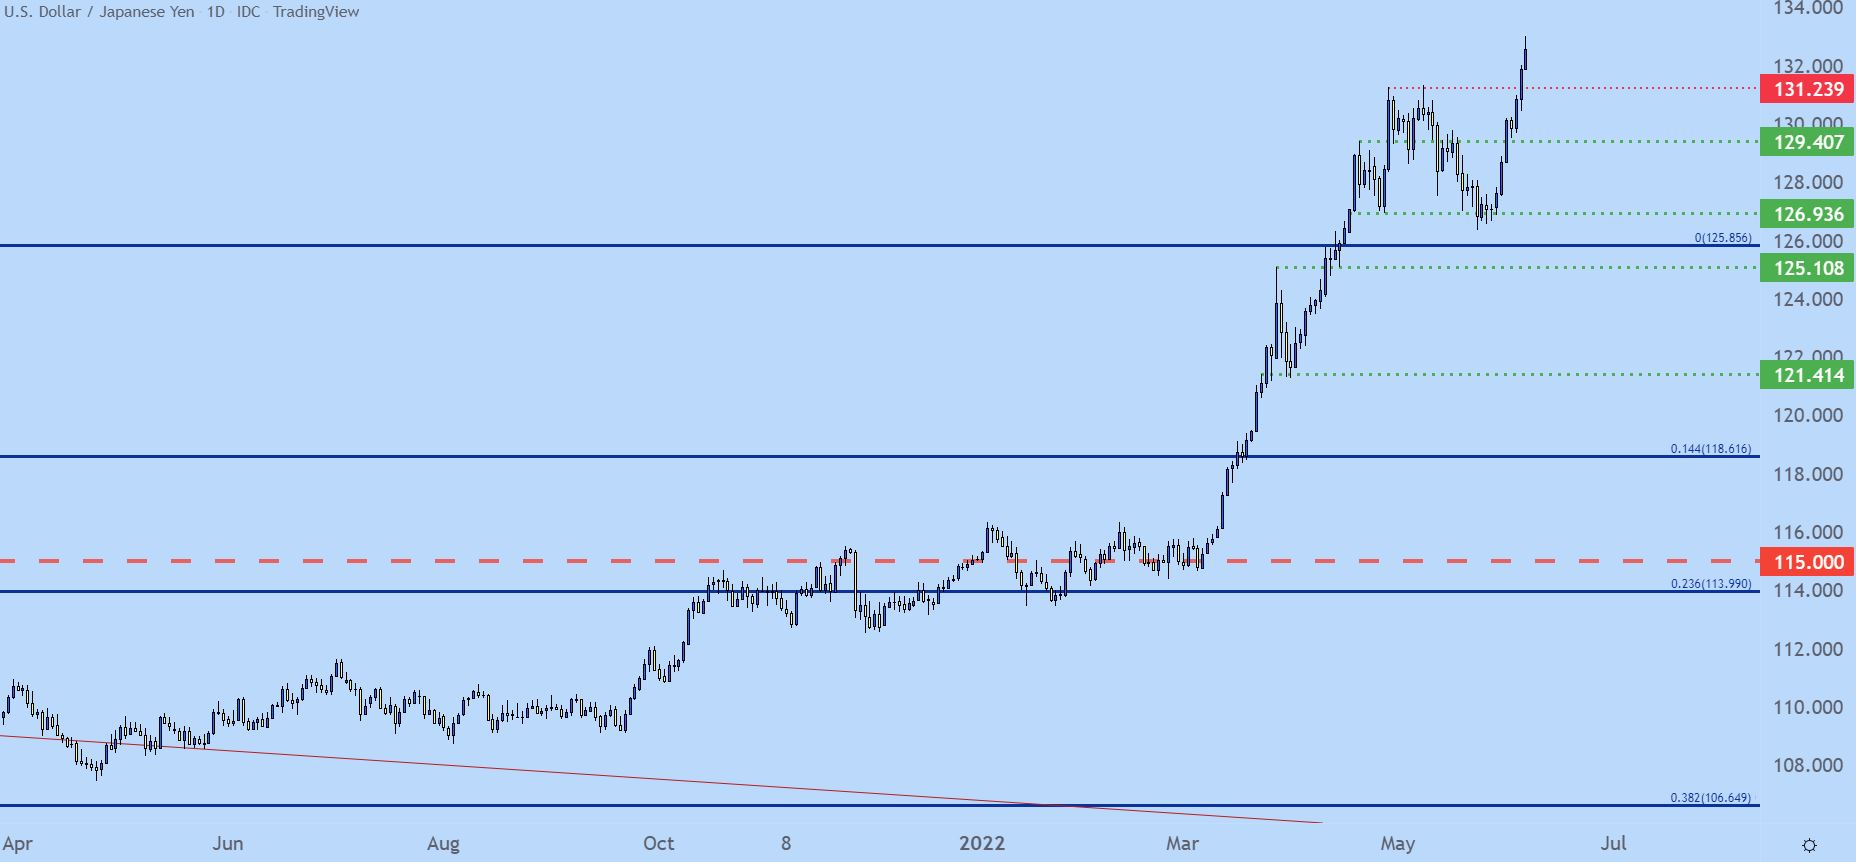
Chart prepared by James Stanley; USD/JPY on Tradingview
US Inflation Data Due on Friday: After the ECB but before next week’s FOMC, we get the next installment of CPI out of the United States. The expectation is for another 8.3% print, matching last month’s data.
And, this might be a spot of optimism for the Fed as last month was the first drawdown in the data point since August of last year. Headline CPI printed at 8.5% in April (for March data) and 8.3% in May (for April data). Another match at 8.3% would keep the hope alive that inflation may have possibly topped, although I’m not personally optimistic for that.
Where this comes home to roost is with stocks. Equities have held on to last week’s gains so far, and it appears that the lack of Fed-speak this week is helping with matters as we’re not hearing a constant chorus of Fed-speakers telling us how aggressively they want to hike rates. Which, brings on another item…
The Fed is being very clear and transparent with their plans. They not only want to hike, the need to hike given the pace of inflation in the American economy. And if inflation does continue to pick up, drawn by forces emanating from the Russia-Ukraine scenario which impacts important commodities like wheat, and the Fed can remain in a difficult spot, even through June and July rate hikes.
I think this could spell more pain for stocks in the weeks and months ahead. At this point, the S&P 500 remains in a ‘box’ formation after testing resistance at prior support last week. I’m looking at this scenario for a breakout (topside) after which a fade can come into the picture.
S&P 500 Daily Price Chart

Chart prepared by James Stanley; S&P 500 on Tradingview
--- Written by James Stanley, Senior Strategist for DailyFX.com
Contact and follow James on Twitter: @JStanleyFX


