


The Elliott wave pattern for GBP/USD can count the 12-year down trend as complete. US Dollar appears to be going through a broad-based weak wave.
The video above is a recording of a US Opening Bell webinar from November 18, 2019. We focused on the Elliott wave patterns for key markets such as GBP/USD, EUR/USD, DXY, USD/JPY, S&P 500, Ethereum, gold, and silver.
GBP/USD Needs One More Rally to Complete Impulse Wave
We introduced the idea back in the October 28 webinar (around the 31:30 mark in the video) that the downtrend in Cable which began in 2007 may be over at the September 3, 2019 low. The rise in GBP/USD since then continues to support the pattern of further gains via an impulse pattern.
An important level looms nearby in the 1.32-1.33 area. This is where the proposed wave 2 and wave 4 trend line passes through. A break above this trend line is a big development as it hints to the 12-year pattern as being completed.
A break above the black trend line does not eliminate bearish wave counts to new lows, but simply elevates the potential for a meaningful and multi-year low being in place.
A correction below 1.2582 will cause us to reconsider the bullish Elliott wave counts.

US Dollar Index Carves Temporary Bounce
US Dollar Index has pivoted lower 98.03 which was in the 9750-9850 zone cited two week’s ago.
The higher probability wave count we are following is that DXY has seen its high and is falling lower in a wave ((3)) to below 94.60. Lower target’s remain in force possibly into the middle 80’s. The point being, according to Elliott Wave Theory, this downtrend could be a resumption of the downtrend we experienced in 2017 and into early 2018.
Read also: how to trade US Dollar Index

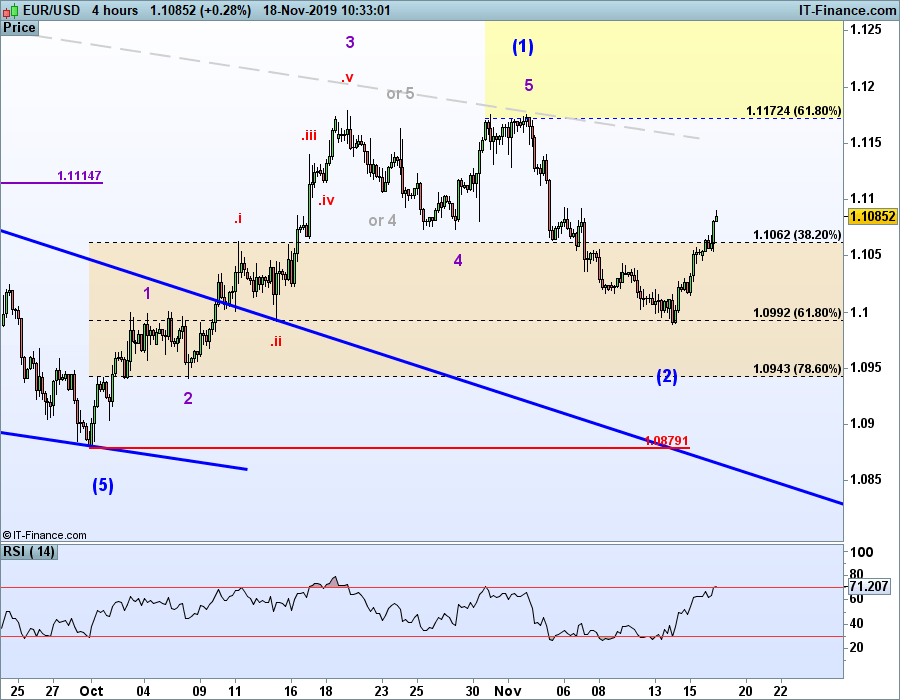
EUR/USD Technical Analysis: Running with the Bulls
EUR/USD continues to build its bullish case by rallying in impulsive structure. Last week on November 11, we identified a bullish reversal zone from 1.0940-1.1000. On November 14, EURUSD trade bottomed at 1.0989 and has rallied since then.
It appears the current wave 3 in EUR/USD has begun and may carry up to 1.15. As this current wave higher is just a wave 3, even higher levels are possible. Depending on how the structure unfolds, we could see EUR/USD eventually trade up to 1.18 and possibly new highs above 1.25.
Though not expected, this bullish scenario is invalidated on a break down below 1.0880.
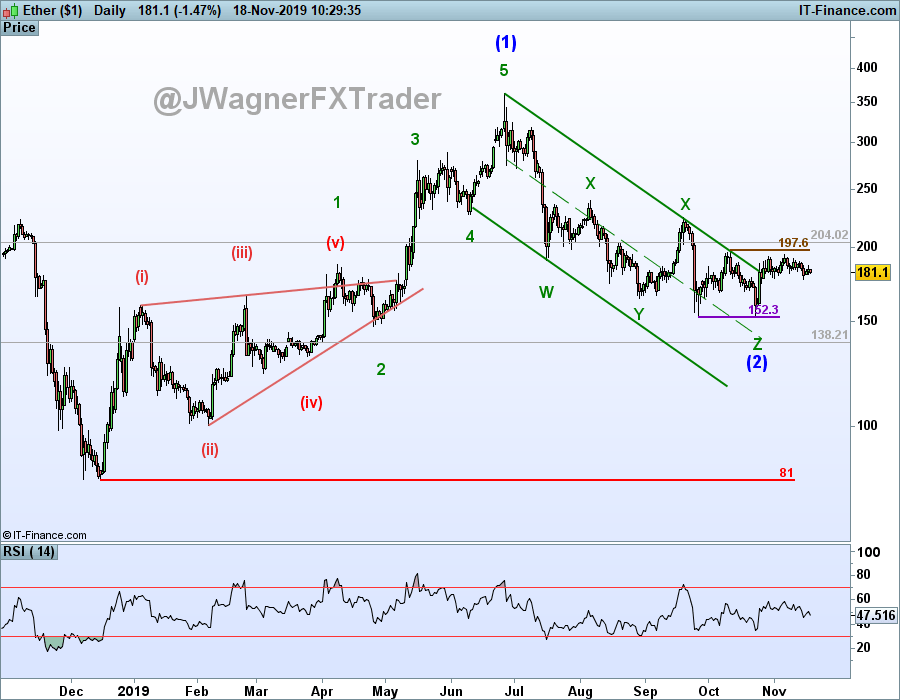
Ethereum Price Outlook Is For An Eventual Break Above $197
The cryptocurrency markets are carving bullish patterns. Though a near-term drop in Ethereum’s price may take it down to 170-175, this correction is viewed as being temporary. The longer-term Ethereum price outlook is for a large rally to reach highs above $364 and possibly new all-time highs above $1500.
A break above $198 would provide further evidence of the advance being underway.
Read more:
A guide to day trading Bitcoin and other cryptocurrencies
Learn more on Elliott wave including the rules and guidelines by grabbing these beginners and advanced Elliott Wave trading guides.
After reviewing the guides above, be sure to follow future Elliott Wave articles to see Elliott Wave Theory in action.
---Written by Jeremy Wagner, CEWA-M
Jeremy Wagner is a Certified Elliott Wave Analyst with a Master’s designation. Jeremy provides Elliott Wave analysis on key markets as well as Elliott Wave educational resources. Read more of Jeremy’s Elliott Wave reports via his bio page.
Join Jeremy in his live US Opening Bell webinar where these markets and more are discussed through Elliott wave theory.
Follow Jeremy on Twitter at @JWagnerFXTrader .


