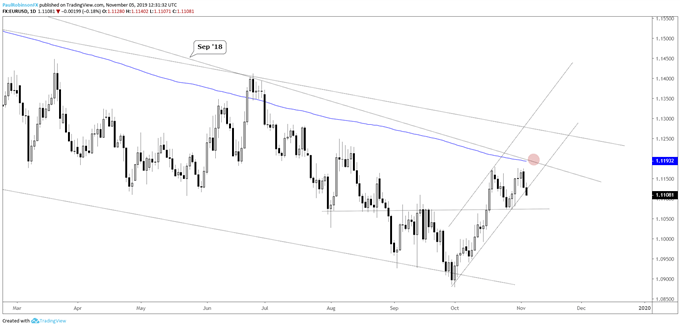
The Euro is in a tough spot, with it trending higher off last month’s low, but doing so within the scope of a broader downtrend. Right now, it is flirting with breaking the trend-line off the October low, and if it does a break through 11072 could have EUR/USD once again rolling downhill towards the lows under 10900.
A hold onto the current uptrend will leave the upside intact and could soon have the Euro attacking the 200-day/Sep ’18 trend-line. If it is reached it will be a big spot to watch how price action plays out. A strong rejection will be noted as possibly marking another intermediate-term swing-high, while a punch through brings to the light the possibility of a larger trend reversal.
For now, giving the benefit of the doubt to the downside until the Euro can prove itself to the top-side.
EUR/USD Daily Chart (watch lower t-line/10729, t-line/200-day)

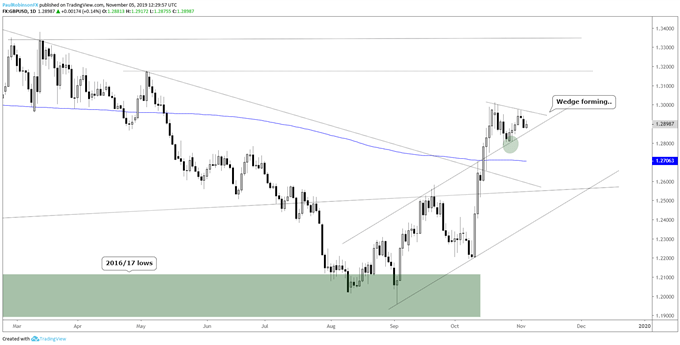
GBP/USD is doing a good job so far of holding onto last month’s surge, currently working on a triangle formation on the upper parallel tied to the trend-line off the October low. A little more time will do the development of the pattern some good before reaching the apex and price breaking out. A bullish break will have the May high at 13176 targeted next as resistance.
GBP/USD Daily Chart (holding onto rally well so far)

For the full set of technical details and charts, check out the video above…
Resources for Index & Commodity Traders
Whether you are a new or an experienced trader, DailyFX has several resources available to help you; indicator for tracking trader sentiment, quarterly trading forecasts, analytical and educational webinars held daily, and trading guides to help you improve trading performance.
We also have a series of guides for those looking to trade specific markets, such as the S&P 500, Dow, DAX, gold, silver, crude oil, and copper.
---Written by Paul Robinson, Market Analyst
You can follow Paul on Twitter at @PaulRobinsonFX


